Technical Analysis: Top 5 Bullish Candlesticks Patterns

- Recap on Reading Candlesticks
- Hammer
- Morning Star
- Bullish Engulfing
- Three White Soldiers
- The Piercing Pattern
- Conclusion
Strong bullish candlestick patterns are vital in an investor’s strategies, especially when trying to spot profitable positions. Investors who look at the bullish vs. bearish candlestick patterns are usually trying to spot a change in market direction, which is an effective entry point.
For example, a formation that indicates a shift in market direction shows that the price is being pushed in favor of buyers, which can cause a big market jump. After the previous market drop, a positive indication on the chart will favor the bulls, encouraging investors to buy because the incline is about to begin.
If you try to identify all bullish candlestick patterns to anticipate a bullish trend, you can end up confused. So, it's important to arrive at a decision by looking at specific pieces of evidence. Initially, positive reversal formations should be present while a market drop is happening. When you see this, note that this is not a bullish formation, but rather a continuation signal. Second, continuation of a positive incline is required by the majority of direction shift indicators. They need to be supported by a strong upward market movement, which could be seen as a gap up or a long hollow bar accompanied by a lot of volume.
Recap on Reading Candlesticks
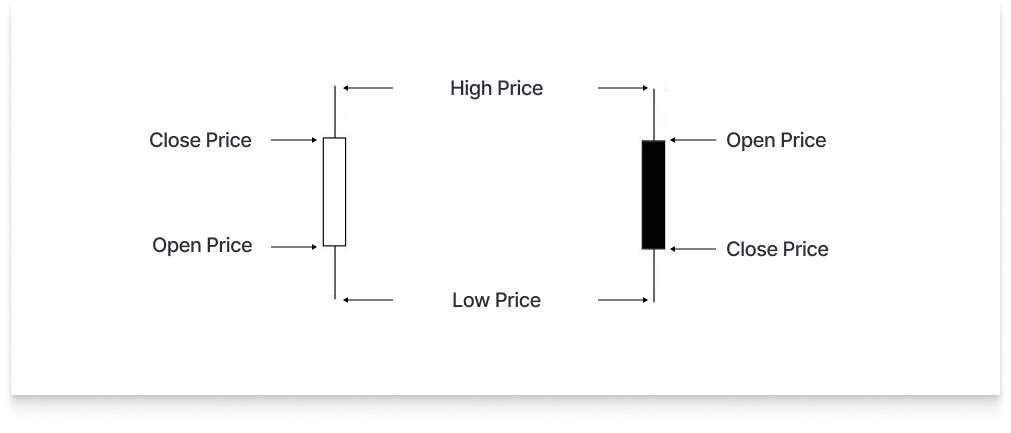
Each candle includes the initial price, pricing movement range, and market close for the given 24-hour period. The "real body" of a candlestick relates to its wide base.
These price representations show the changes in the asset’s value that happened over a 24-hour period. The end was lower than the beginning when the price bar was dark or filled in. The absence of any kind of bar/body implies that the day ended in the green, having a higher value than its opening price.
On the trading platform, investors may change these hues. For example, it's common to use red instead of black to show a downward trajectory and green instead of white to show an upward one.
With that in mind, let’s take a look at the top 5 bullish candlestick formations for crypto trading.
Hammer
The formation happens when an asset opens much lower than its closing value, but then stages a strong rally. The formation creates a literal hammer-like outline, with a bottom wick that is at least twice as large as the body. The formation is indicative that the bears have given up, and the value of the asset is now slowly rising, signaling a possible shift in market movement. This takes place in an isolated period, during which the market drops on its opening, but soon recovers near the start.
The next price bar can confirm the formation. If it opens with a big market bump and then closes well above the value at which the pattern ended. This indicates sustained purchasing activity. Investors often buy positions after other indicators have already verified the chart formation. Stop loss orders are set at the formation’s lowest point. If the asset is rising strongly upward while the validation is happening, the stop loss should be set under the pattern’s body.
Even with solid evidence, the formation is rarely referred to independently. Often, investors use technical indicators, market analysis, and trend analysis in conjunction to validate these good signs.

Morning Star
The Morning Star consists of three bodies that appear after the previous market drops. It means that the asset value is about to go up. However, investors wait for a morning star to emerge and still look for more indications to confirm a shift in the market direction.
Since a morning star may be seen with the naked eye, no special computations are required to identify it. Three candles form a morning star, with the second candle being the lowest. But it is only when the third price bar has closed that the low point becomes visible. The number of trades in this formation is vital to confirm its potency in the coming days.
In general, the volume should rise over all three trading sessions within the bullish formation, with higher trades happening on the third day. Although additional signs may be involved, a third-day volume increase is commonly seen as confirmation (and the upswing). Following the third-session formation of a morning star, positive positions in the underlying assets are opened until further signals indicating a trend shift are seen.

Bullish Engulfing
The formation forms during a period represented by a green body -- a great indication of positive sentiment. It happens when the day ends at a higher value compared to its opening. The bullish engulfing formation is recognized by the presence of a small red bar (indicating a long-term bearish movement) followed by a massive green body (indicating a positive market movement), the body of which totally covers or engulfs the body of the preceding bars. In addition, the green bar usually has a short upper wick, if any at all. This indicates that asset value continues trending upwards and closes at or around its greatest point.
A bullish engulfing candlestick chart pattern occurs when a red candle is followed by a bigger hollow candle, which is seen during a downward movement. The formation's second day begins with the asset’s value being lower. Nevertheless, the high number of purchases push the market up to a larger degree than the previous high, resulting in a clear victory for the buyers.
This formation occurs when the market opens lower on the second day than it did on the first day. It indicates that the bears initially dominated, but were eventually overthrown by the bulls just as the trading day closes. If the market didn't drop quickly, the green bar wouldn't be able to cover the red candle from the day before.

Three White Soldiers
It’s a bullish candlestick pattern, showing a respite from an ongoing drop. It occurs when three successive long-bodied candles all begin around the end of the real body of the prior candle and end trading above its peak. These candles shouldn't suffer from long wicks and should preferably open within the previous day's real body.
The shift in market mood is strongly indicated by the pattern’s existence. A closing candle containing a small or no wick indicates that buyers have maintained dominance of the session high. Essentially, the bulls dominated the rally throughout the session and ended around the day's high for 3 straight sessions. Additionally, other reversal-suggesting signals can appear after the formation has appeared.
The formation is used as a gateway from or to enter a trade. For investors who have already opened long positions, the existence of this formation warns investors to exit. But, for those who want to enter a positive position, it signals a good time to do so.
On the other hand, the powerful upward swings within this formation might lead to temporary overbought situations. For example, the RSI may have reached or exceeded seventy points. After the bullish formation, a period of consolidation can sometimes ensue, but the near- and intermediate-term outlook is still positive. However, the asset may suffer from consolidation at major resistance levels if the price gains enough momentum.

The Piercing Pattern
Some investors look for a piercing formation to anticipate a positive shift in market direction from a negative price movement. It is a two-day market formation, where the first day ends with a gap down, and then day two opens around the low and ends near the high. The closing chart bar should have a body that covers at least half of the upward length of the red body from the preceding day.
The first day of a piercing formation is heavily dominated by sellers, while the second day is driven by eager purchasers. This could indicate that the bulls have become stronger and that the volume that market participants wish to sell has been exhausted. The prevailing price volatility is indicating that the approaching outlook will be positive.
A bullish piercing candlestick pattern is rather uncommon in its purest form, but it appears to function more effectively the longer the downturn is in front of it. This two-day formation is more convincing when it coincides with a bullish divergence in RSI, Stochastic, and MACD.
After the formation manifests, an investor should keep an eye out for a breakaway gap, as the formation is usually simply a potential indicator for a shift in direction. The initial stage of a shift in direction is characterized by a breakaway gap. You can recognize the formation if the spread between the closing and open of two succeeding days is relatively large and stays that way for both red price bars. The existence of this signal and an upswing is indicative of a possible change in direction.

Conclusion
Many people see technical and fundamental research as being at odds with one another when it comes to crypto. But some traders have discovered that by combining the two, they may be able to maximize their returns. Once possibilities have been uncovered via fundamental study, buying and selling levels may be pinpointed using technical analysis.
A common practice among charting experts is to verify their findings in conjunction with the underlying micro and macro market factors. An investor may examine the underlying fundamentals if a breakout occurs just before a major report to determine the likelihood that the report will exceed earnings forecasts.
Aside from identifying bearish and bullish candlestick patterns, there’s also another way to increase your profits in crypto trading. A lot of professional crypto traders use an automated trading journal like Trader Make Money to look at their trading strategies and performance. Using a trading diary, pro traders can monitor their trading data and behavior. For example, Trader Make Money has a number of analytics widgets that can help traders figure out why they won or lost a trade. This lets traders keep getting better at making profitable trades.