7 Best Indicators for Crypto Trading

Technical analysis indicators, which have appeared quite a lot since the start of financial markets, help traders achieve maximum accuracy of forecasts. There are also a lot of custom indicators. But if you are a beginner, it is better to start with classic tools.
In this article, we are gonna review TOP 7 most popular (and useful) indicators for those new to the world of crypto. You can use them to generate huge profits. Let’s start with a short definition. What are indicators at all?
Indicators predict the movement of the market. They can also be used to show price behavior patterns. You can develop strategies using these patterns.
Some of the best technical indicators for trading include Volume, Moving Average Convergence, Exponential Moving Average, MACD, Relative Strength Index, Stochastic Oscillator and Fibonacci Retracement.
The Volume
It is a fundamental indicator for the analysis of any market, showing the interest on the part of the market players. In other words, Volume is an indicator allowing to track the number of trades made by traders over a certain period of time.
With low volume, it is difficult to interpret the currency movement, as it is liquidity that brings safety to trading.
There are candles on the chart, green and red ones. Red candle signal a decrease in volume, green ones indicate its growth.
Analyzing volume of trades along with the background of the price movement chart, it’s possible to confirm the strength or identify the weakness of the trend and predict a price reversal. If prices go up and the volume of trades increases, we state a bullish trend. An increase in trading volume in the event of a decrease in prices indicates a bearish trend. Remember a few rules:
- Volume has a tendency to jump wildly, which at times could distort real picture.
- The higher volume of completed trades, the bigger rate dynamics.
- A confident trend is confirmed by unidirectional increase in volume and price. If prices rise, we buy assets; if prices fall, we sell.
- A decrease in volume may signal reversal.
- A decrease in volume during a breakdown may indicate false signals, while a growing volume, on the contrary, confirms the trend.
Moving average
It’s another popular indicator, and it’s actually the most classic tool on the market. The Moving average is easy to interpret, that is why it stays one of the traders’ favorite indicator over time.
The indicator analyzes the average (just like the name) price for a set time interval. The MA chart is overlaid the chart of current price movement, which gives a relative view of the price trend. If the current cryptocurrency price stays above the MA during a long time, we may assume its growth. Accordingly, if the actual price is lay under the moving average, it is a signal for its decrease.
To get more accurate forecasts, it is better to track various moving averages grounded on different periods of time. Forms of Moving average:
- SMA - simple moving average;
- WMA - weighted moving average;
- EMA - exponential moving average.
* If they are differed, we take the average, based on a longer period of time. If the signals from various MA coincide, we can talk about a fairly accurate forecast.
And why is MA so utile for the market? Knowing the average price of an asset, let us analyze, through the slope of the curve, the best buy and sale prices after identifying the market trend.
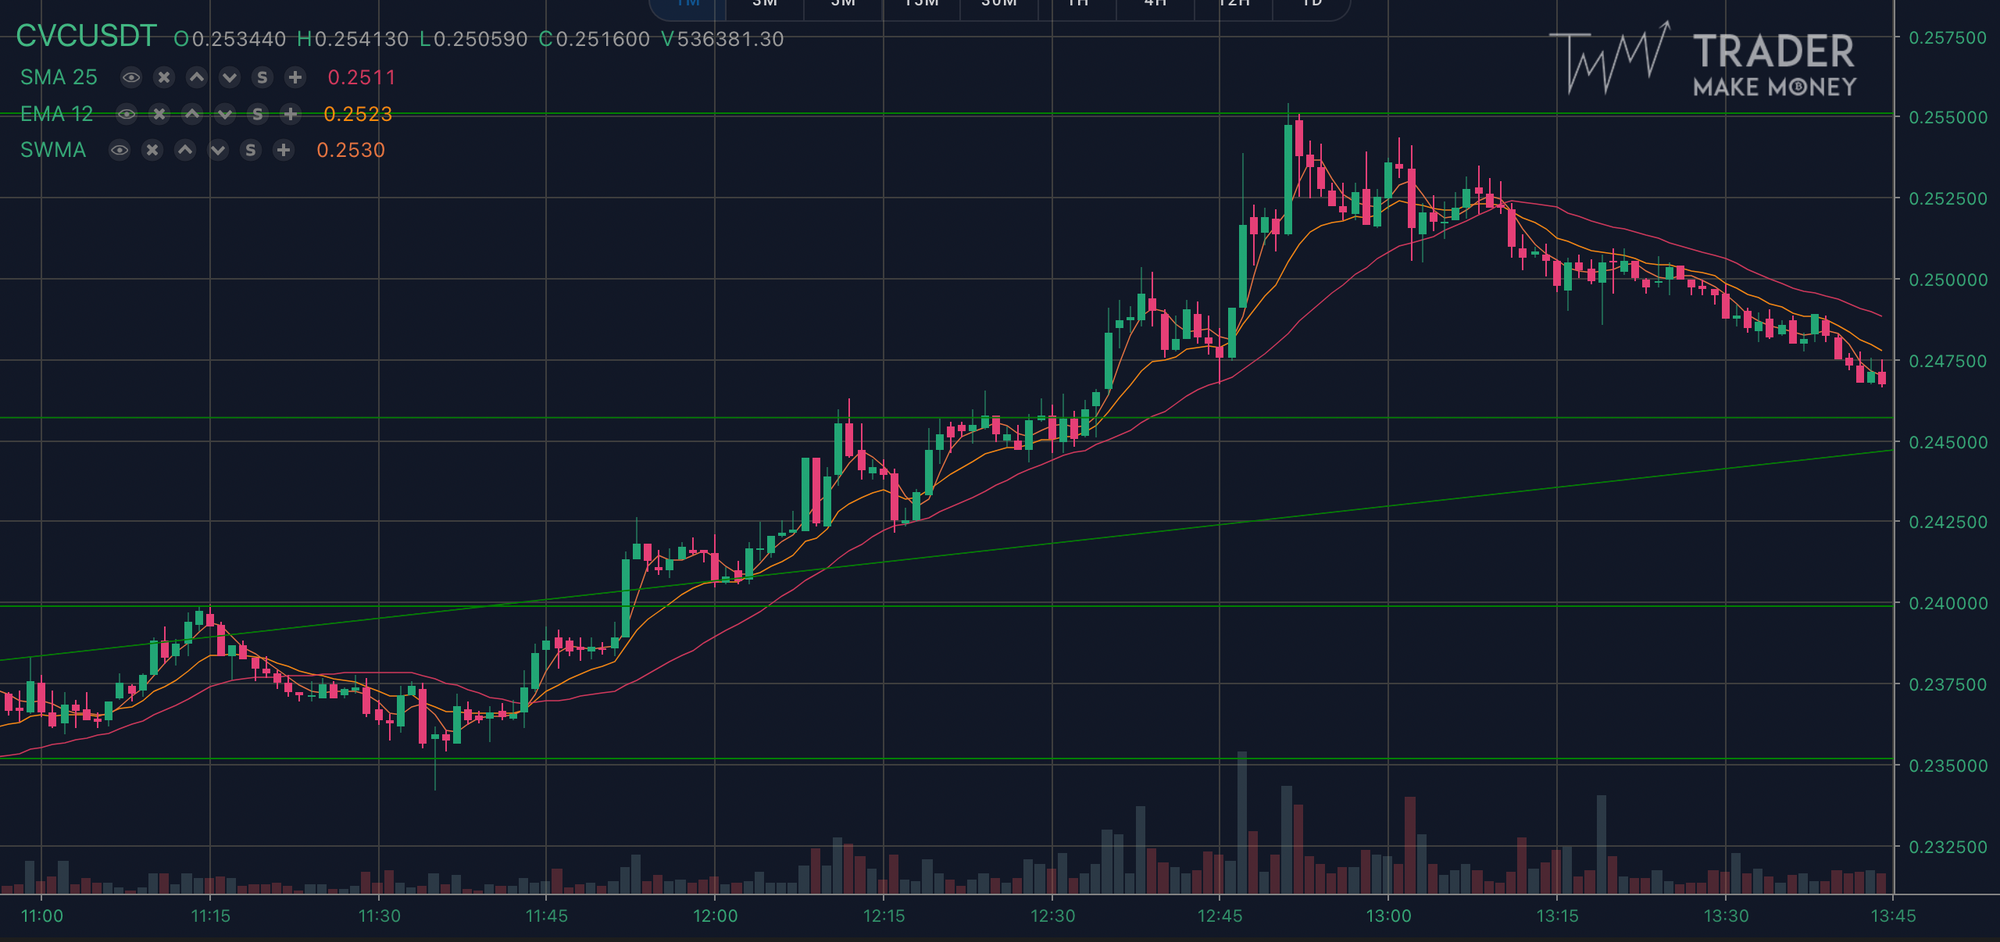
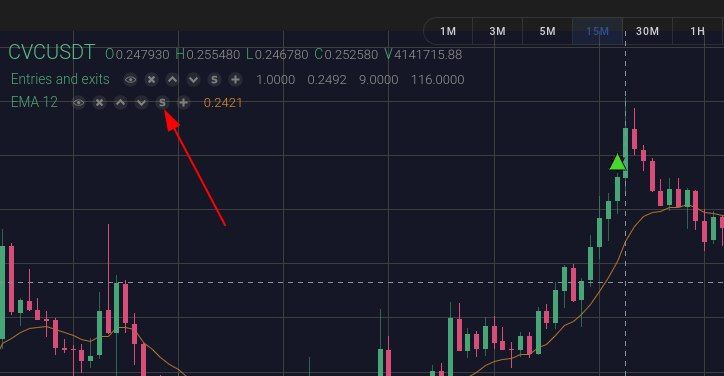
EMA
Let's have a closer look at this indicator. EMA is a moving average type that prioritizes the most recent data points. It helps more accurately find out the tendency of the trend. 2 indicators with 15 and 30 candles intervals give you the most accurate prediction. EMA depends on the past prices which means the indicator is lagging, that is why it’s called lagging. And it can’t predict anything, but help set the tendency of the trend. If both averages go up, the trend is up. Down means descending. The crossing of two EMA confirms the direction of the trend.
The gap between 2 EMAs points to the force of the price movement - volatility. The stronger the price range, the wider the gap. What, most likely, will reduce (or even stop) the growth.
MACD
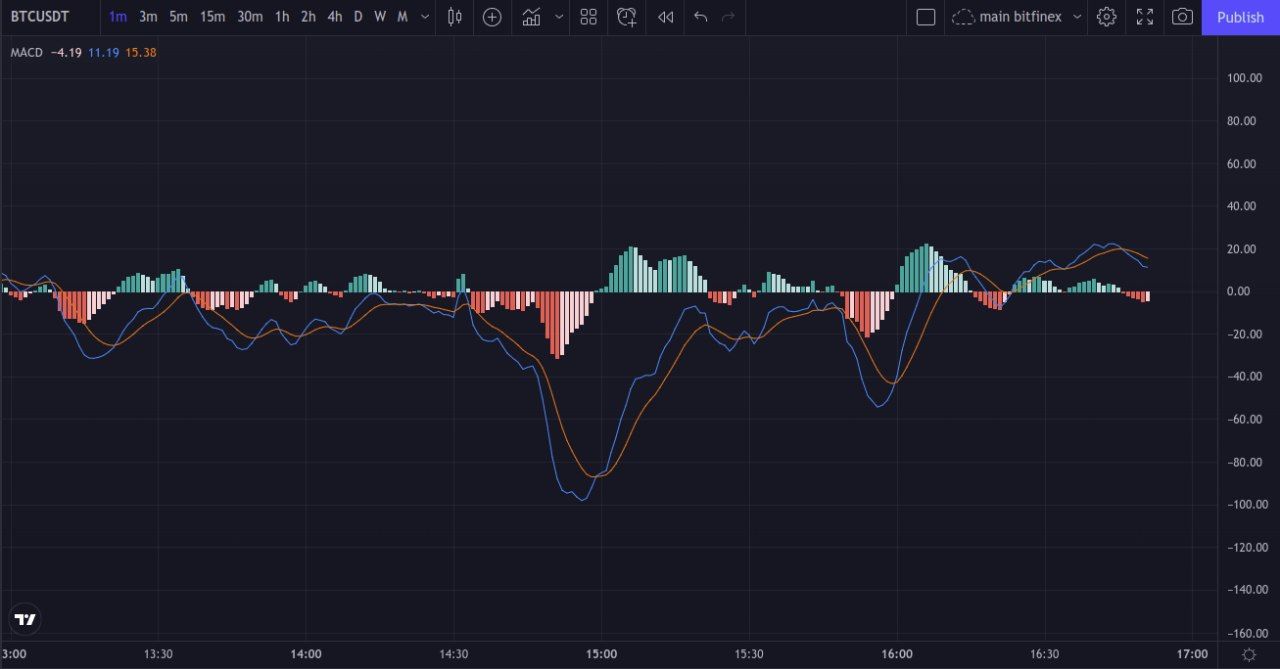
MACD is a Moving Average Convergence-Divergence Indicator. It's one of the most widespread momentum-based technical indicator. MACD shows the impulse of trends, regarding the correlation between two moving averages. It consists of 3 components:
- MACD = 26-period EMA – 12-period EMA
- Signal Line = A 9-period EMA of the MACD.
- MACD Histogram = MACD - Signal Line
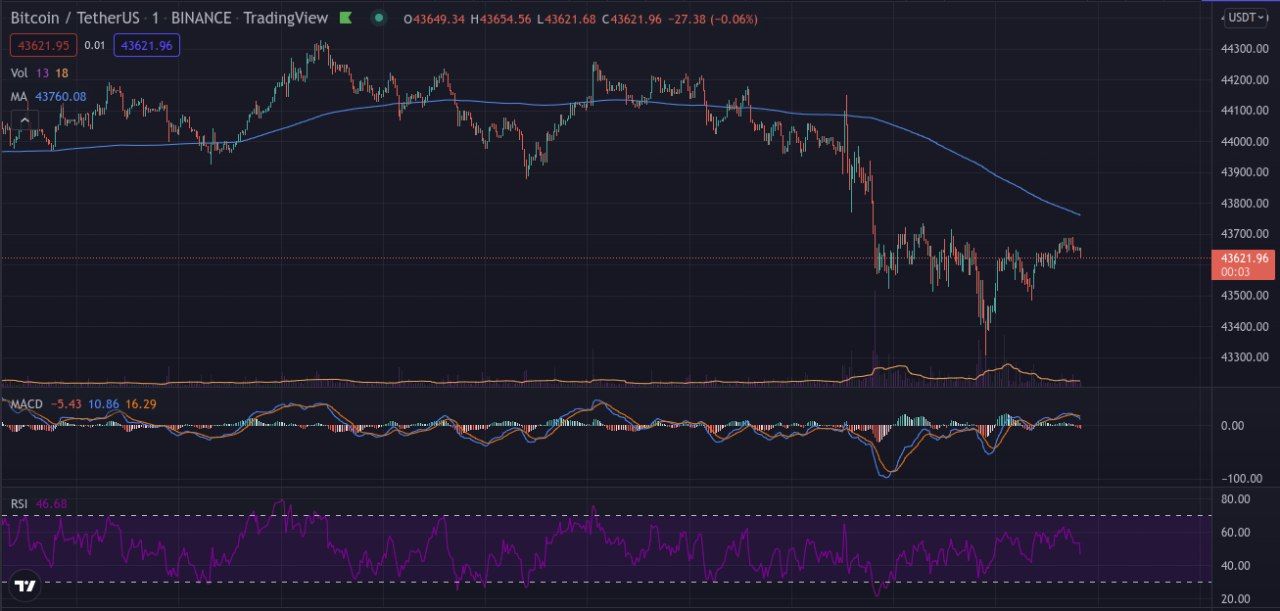
MACD is dependent on moving averages, what makes it lagging. But it is still accurate and reliable. Besides, MACD supplies enough flexibility because it can be applied to price charts of different time frames.
Positive MACD indicates an uptrend. Rushing to an up signal line means a good time to buy, called a bullish cross. Negative MACD indicates downtrend. When MACD crosses the below signal line, it is a good time to sell, called bearish crossover.
RSI
Relative Strength Index shows the market overbought or oversold. It indicates the weakness or strength of a cryptocurrency through its price previous changes. These changes show if an asset has been overbought or oversold.
Being used along with the EMA, increase their productivity and allow you to approve each of the indicators and take a position as profitably as possible.
This is how RSI is calculated:
RSI = 100 – 100 / (1 + RS)
RS = Average of periods which close up in price / Average of periods which go down in price
* Usually the number of periods used is 14, but you can choose any.
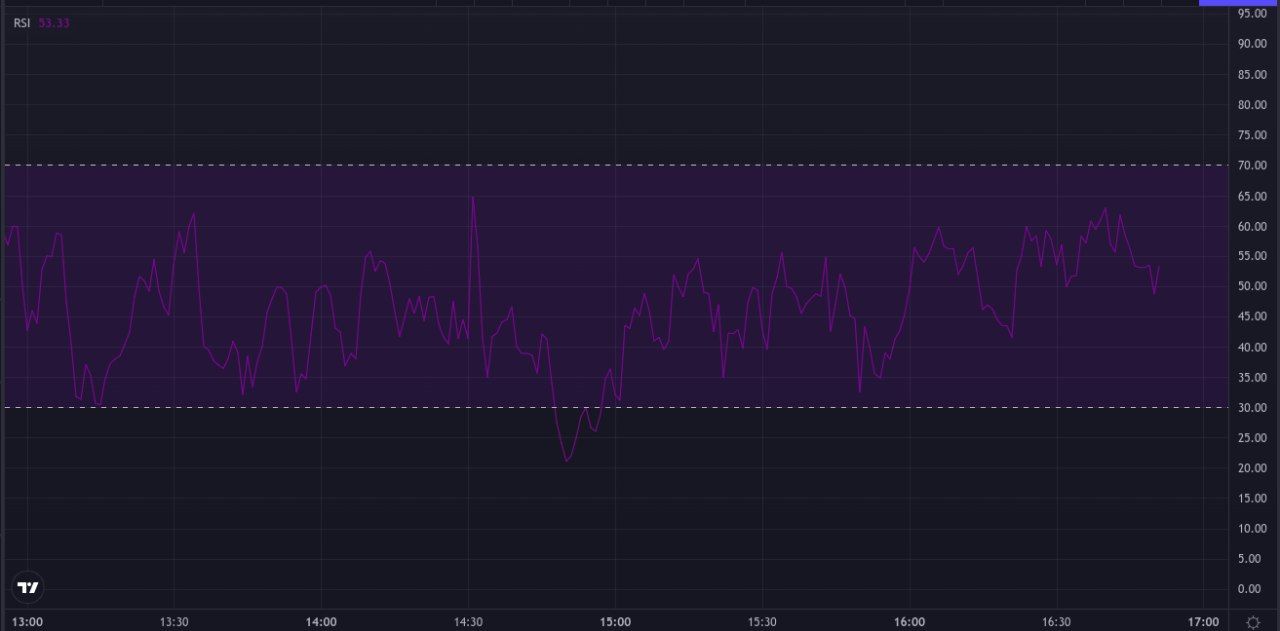
RSI chart has two important marks, at the top and at the bottom. And when the curve crosses these marks, it shows an oversold or overbought market. Generally, its value is under 30, it indicates the asset has been oversold. And f the value is over 70, it indicates the asset’s overbought.
Relative Strength Index helps you determine the point of sale (red area) and buy (green one).
Pay attention, that while there is an uptrend, RSI is typically between the lower limit and upper one, try to break it out. It seldom dips into the green area, but it comes, it’s surely a buy signal.
But when there is a downtrend, the situation is mirrored. Analyzing the price chart along with RSI, let's mentally line at 50 - it would be a set level, where the price chart is uniting with a high probability. When the price chart “touch” this level, the price may “bounce” disposition with the trend. Typically, such a behavior is observed during a strong movement.
Fibonacci Retracement
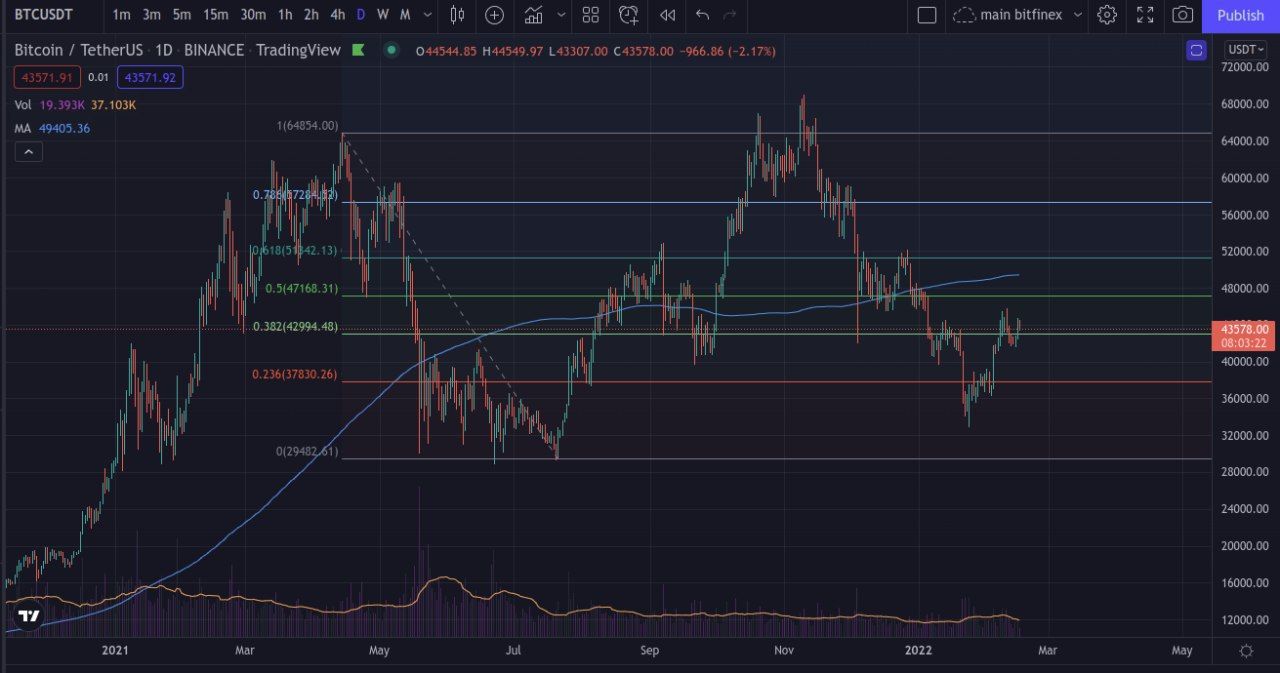
This indicator is based on retracements (periods when the price goes against the trend, then it moves back along with the trend direction). These movements endure for short periods. The Fibonacci retracement uses numbers pointed out by a mathematician in the 13th century.
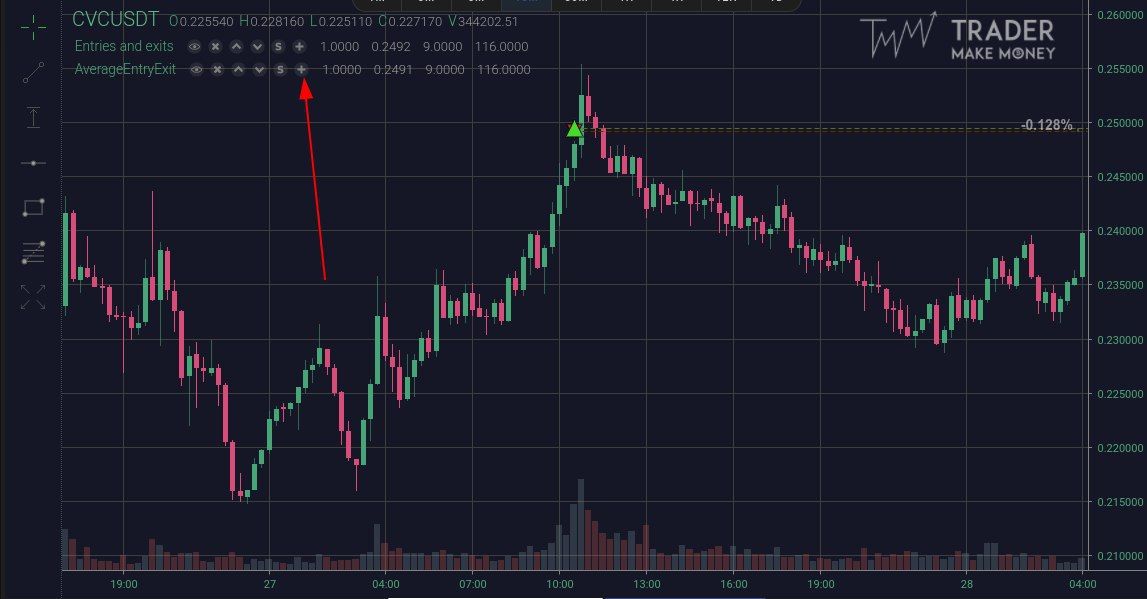
The indicator helps predict entry and exit points and whether you should go long in the market or sell. Assets' prices will likely turn toward the trend tendency when they reach certain Fibonacci retracement levels. You can set up the Fibonacci indicator levels to find out signals for a possible reversal and open a position the same tendency as the primary trend.
Fibonacci trading strategy means searching entry points at the retracement and waiting for the price to move back in the direction of the initial trend. It may also be used to identify signals for a potential reversal in prices.
Stochastic Oscillator
Stochastic RSI is the other name. The final indicator on this list should be used cautiously. It is a momentum indicator, determining the time of entry and exit in a trade depending on whether the fundamental financial instrument is overbought or oversold. It’s frequently "sticks" to the upper and lower boundaries, what hinders a trader to make the right decision.
The Stochastic Oscillator oscillates within values 0 and 100, carrying the impulse of the asset. Timeframe is usually 14-period which could be days, weeks, or even months depending on your goal.
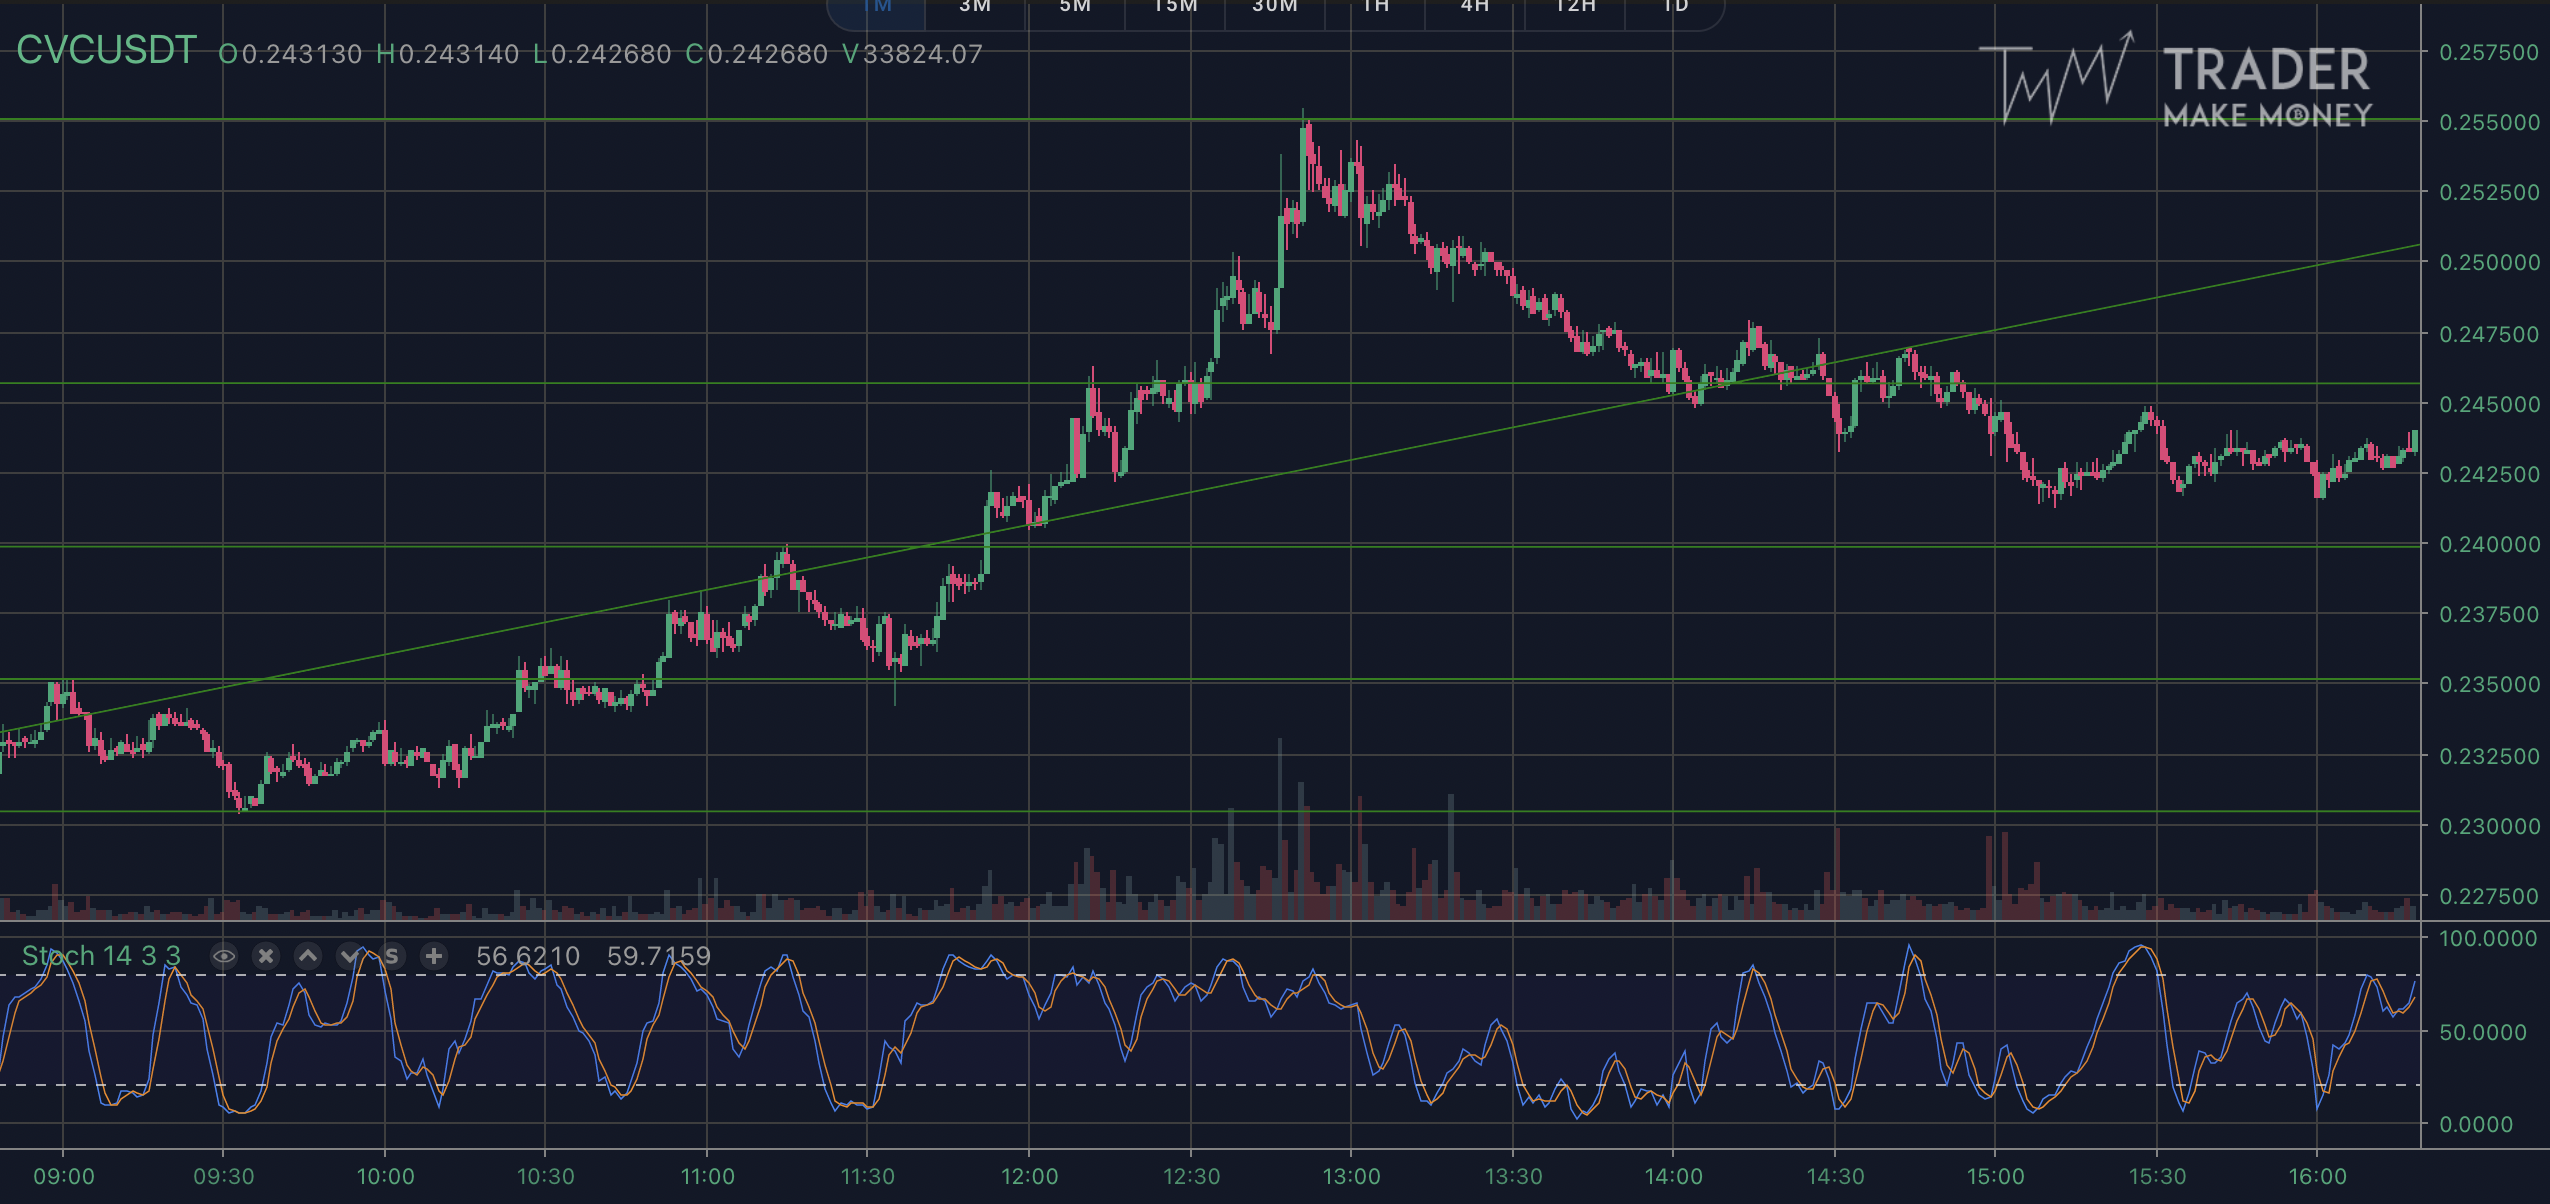
Sweeping movements of Stochastic Oscillator curve could make it hard to see the trend. But it’s many easier to use it together with RSI. Then you can get a clear signals.
If the Stochastic Oscillator wedges to the top and the RSI approaches high values (outside the green), it's time to get into position. To avoid errors, it is better to use broader timeframes (this actually could be applied to any indicator). Still, do not stuck on one time interval.
There are just a few of the best indicators on, and there are many more. You can find more metrics in our journal. All of them are easy to understand, and you can immediately apply it to improve your trading performance.
You can add all indicators you need at one chart. Make it in a few simple steps.
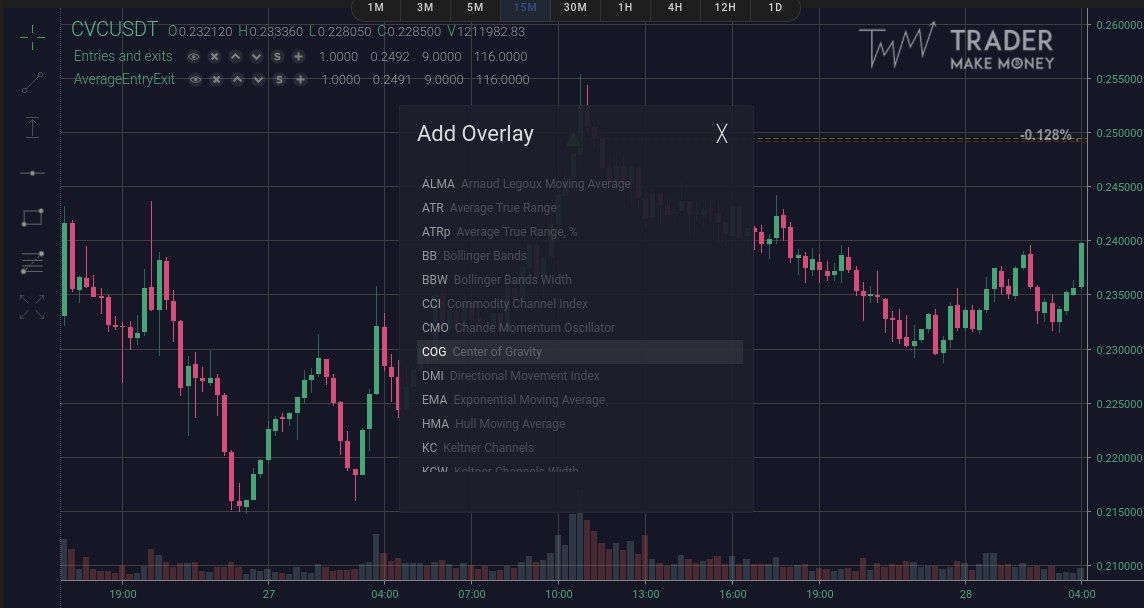
Moreover, each indicator has its own settings.
To get free access to our TMM journal, follow the link 👇
CREATE FREE ACCOUNTConclusion
We have tried to make a short review on top trading indicators and their importance. Understanding trading indicators, their utility, and limitations is necessary before applying any. Matching this knowledge with your risk appetite and time in hand is necessary to become a successful trader. It's much easier to do with TMM trading journal!