OKX Exchange Integration and More in Latest TMM Updates


Hello, traders! We're excited to share some significant updates to our Trading Journal. These enhancements are designed to provide you with deeper insights into your trading activities and streamline your experience. Let's dive into the details:
Exciting Update - OKX Exchange Integration Now Live!
We're thrilled to announce the most anticipated and eagerly awaited update to our platform - the integration of OKX Exchange! This major enhancement is set to revolutionize your trading experience with us. Here are the key features of this update:
- Limited 3-Month: Currently, we're offering a history span of three months. This limitation is due to the extended download time required for longer periods, a unique aspect of the OKX Exchange. However, we're exploring ways to extend this history span and will keep you updated on any changes.
- Charts Sourced Through Our Server: In a significant development, due to OKX's restrictions on their clients directly accessing charts, we have configured our system to load these charts through our server. This integration ensures a seamless and consolidated view, functioning through a single point of integration.
📌 Key Integration: To integrate your OKX account with our platform, simply select 'TraderMake' from the list of third-party applications available on the exchange. This step is crucial for syncing your trading data and accessing all the new features.
New Widgets Added:
- Profit Distribution by Trade Volume: This widget groups trades, for example, by volume and displays how metrics like profit change accordingly.
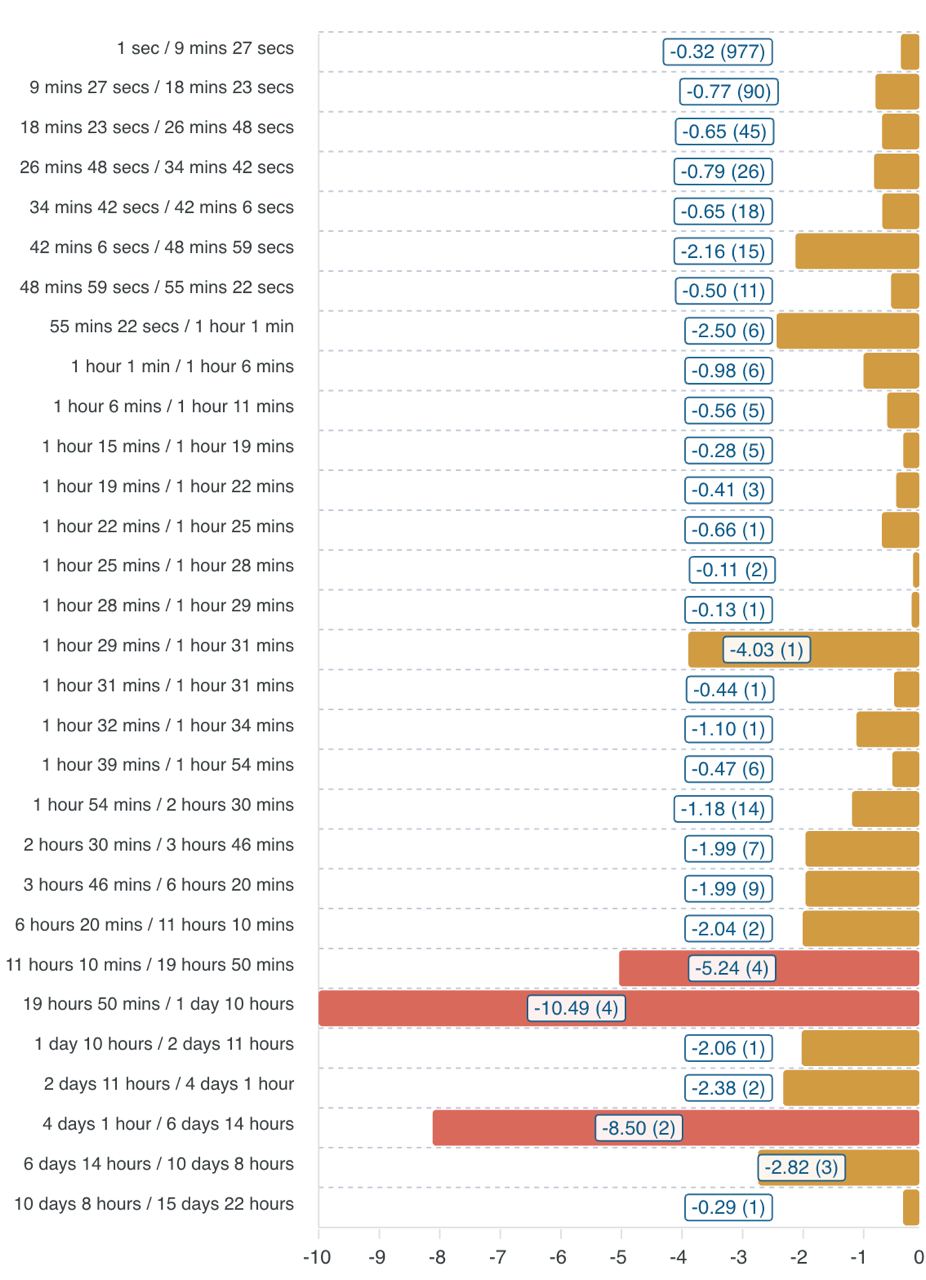
- Profit Distribution Over Time in a Trade: This widget displays the standard distribution of profit across various time frames within a trade. It is instrumental in discerning the most profitable or loss-inducing durations, thus guiding the timing of trade entries and exits.
- MFE Distribution Over Time in a Trade: This widget illustrates the standard distribution of Maximum Favorable Excursion (MFE) over time within a trade. It reveals when the highest potential gains are typically observed, aiding in determining the optimal moments to close positions for profit maximization.
- MAE Distribution Over Time in a Trade: This widget visualizes the standard distribution of Maximum Adverse Excursion (MAE) across different time intervals in a trade. It highlights the typical times during a trade when the largest negative price movements occur, providing insight for refining risk management tactics.
- Trade Distribution by MAE: This widget presents the standard distribution of Maximum Adverse Excursion (MAE) for a collection of trades. It's valuable for understanding the regularity of negative price movements, which is crucial for setting appropriate stop-loss orders.
- Trade Distribution by MFE: This widget plots the standard distribution of Maximum Favorable Excursion (MFE) for a series of trades. Traders can analyze the commonality of favorable price excursions to adjust strategies for better capitalizing on positive movements.
- Trade Distribution by Profit: This widget shows the standard distribution of profit for a group of trades. By depicting the usual profit or loss trends, it serves as a foundational tool for strategy evaluation and enhancement.
These updates are aimed at enhancing your trading analysis and decision-making process. We hope you find these new features useful and they help you in achieving your trading goals. As always, we welcome your feedback and suggestions for further improvements.
Happy Trading! 📈🚀
Love, TMM