
Навіщо бектестити свій ризик
Більшість трейдерів обирають ліміти ризику навмання («ризикуватиму 1% на угоду»). Історичний симулятор ризику відповідає, чи справді це число підходить вашій стратегії: він прокручує вашу реальну історію крізь правило, яке ви хочете перевірити.
Важливо: система — це монітор, а не виконавець. Вона не закриває позиції на біржі автоматично — вона попереджає, коли ви відхиляєтесь від плану, щоб дисципліну ви побудували самі. Про саму концепцію контролю ризику читайте в розділі «Ризик-менеджмент».
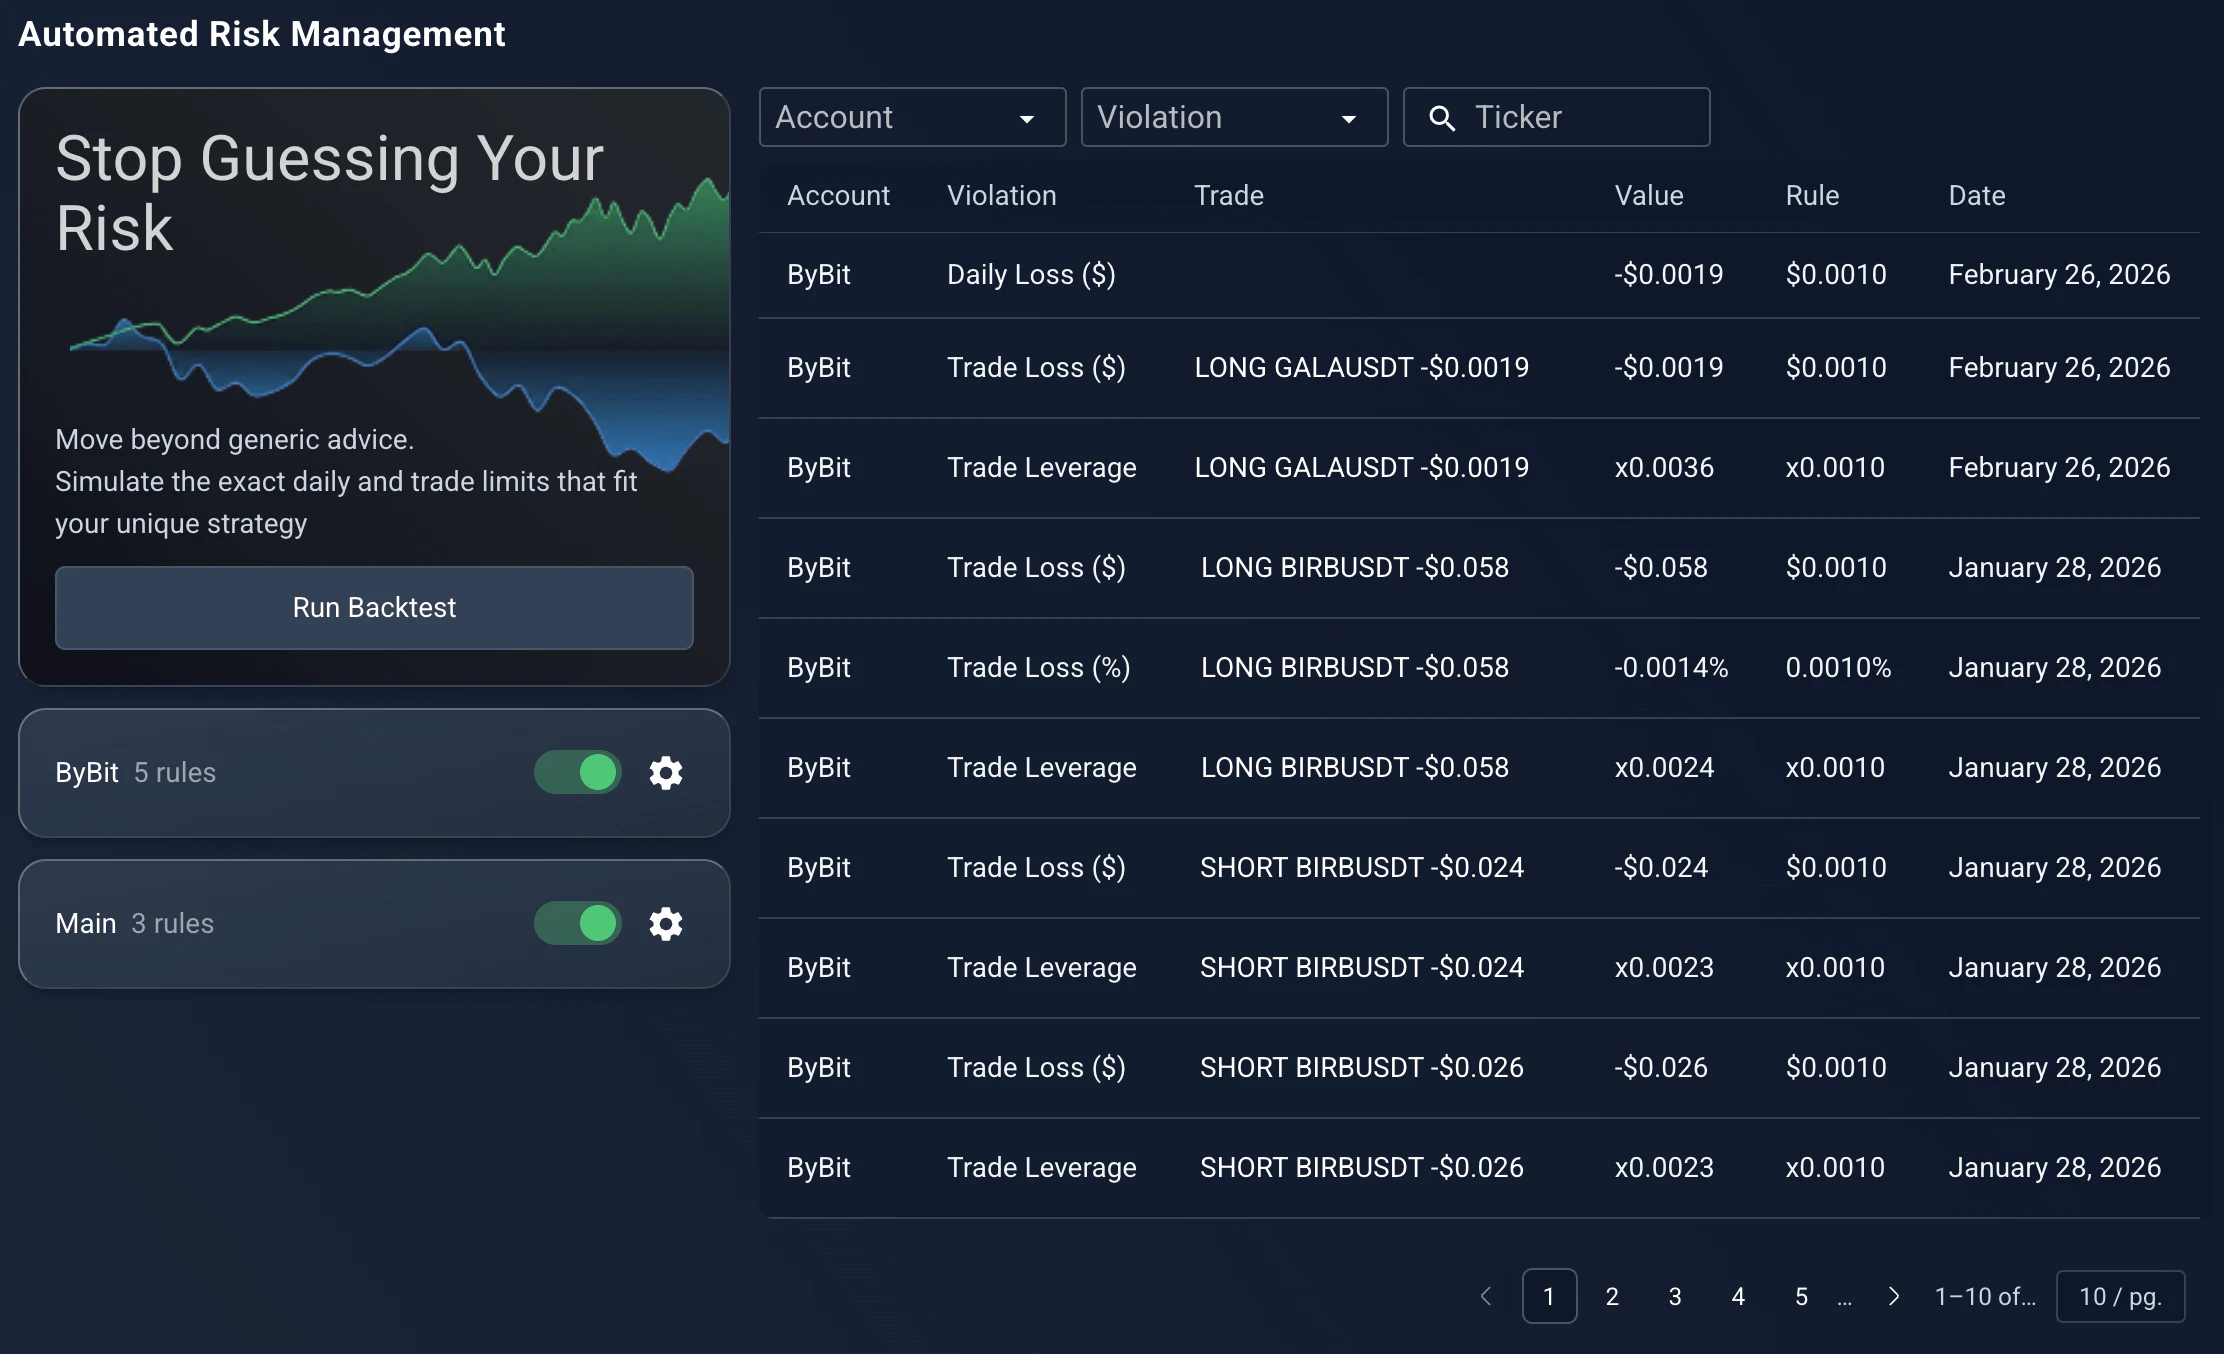
Розділ керування ризиком: дослідна лабораторія вашої торгової дисципліни.
Risk Management, /app2/account/risk-management. Reused from _media/risk-management-v2/rm_overview (Mar 2026 rewrite).
Крок 1 — оберіть рівень
Правила можна тестувати на двох рівнях:
- •Глобальний ризик-менеджер — як правила вплинули б на весь ваш портфель разом.
- •Ризик-менеджер для рахунку — перевірка конкретних стратегій на конкретних субрахунках (жорсткий стоп на «Скальпінг», м'якший — на «Свінг»).
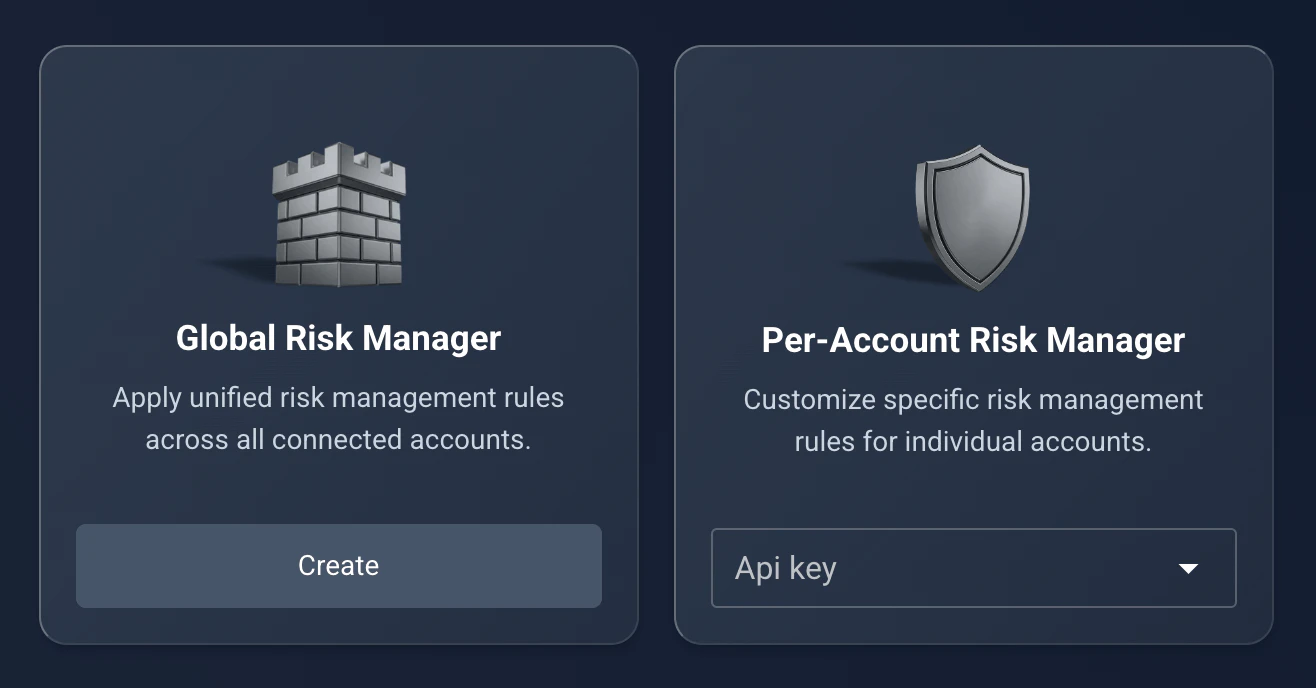
Крок 1: оберіть глобальний рівень або рівень окремого рахунку.
Backtester scope select, /app2/account/risk-management/backtest. Reused from _media/risk-management-v2/backtest_step1 (Mar 2026); labels match riskManagement/locales/en.ts.
Крок 2 — сформулюйте гіпотезу
Введіть ліміти, які хочете перевірити — вмикати їх не потрібно, це лише симуляція. Типові питання, на які відповідає бектестер:
- •Макс. збиток на угоду — «якби я різав кожен збиток на −$50, скільки б я зберіг?»
- •Макс. денний збиток — «якби я зупинявся після −2% за день, чи уникнув би спіралі ревендж-трейдингу?»
- •Макс. кредитне плече — «високе плече справді збільшило мій прибуток чи лише комісії та збитки?»
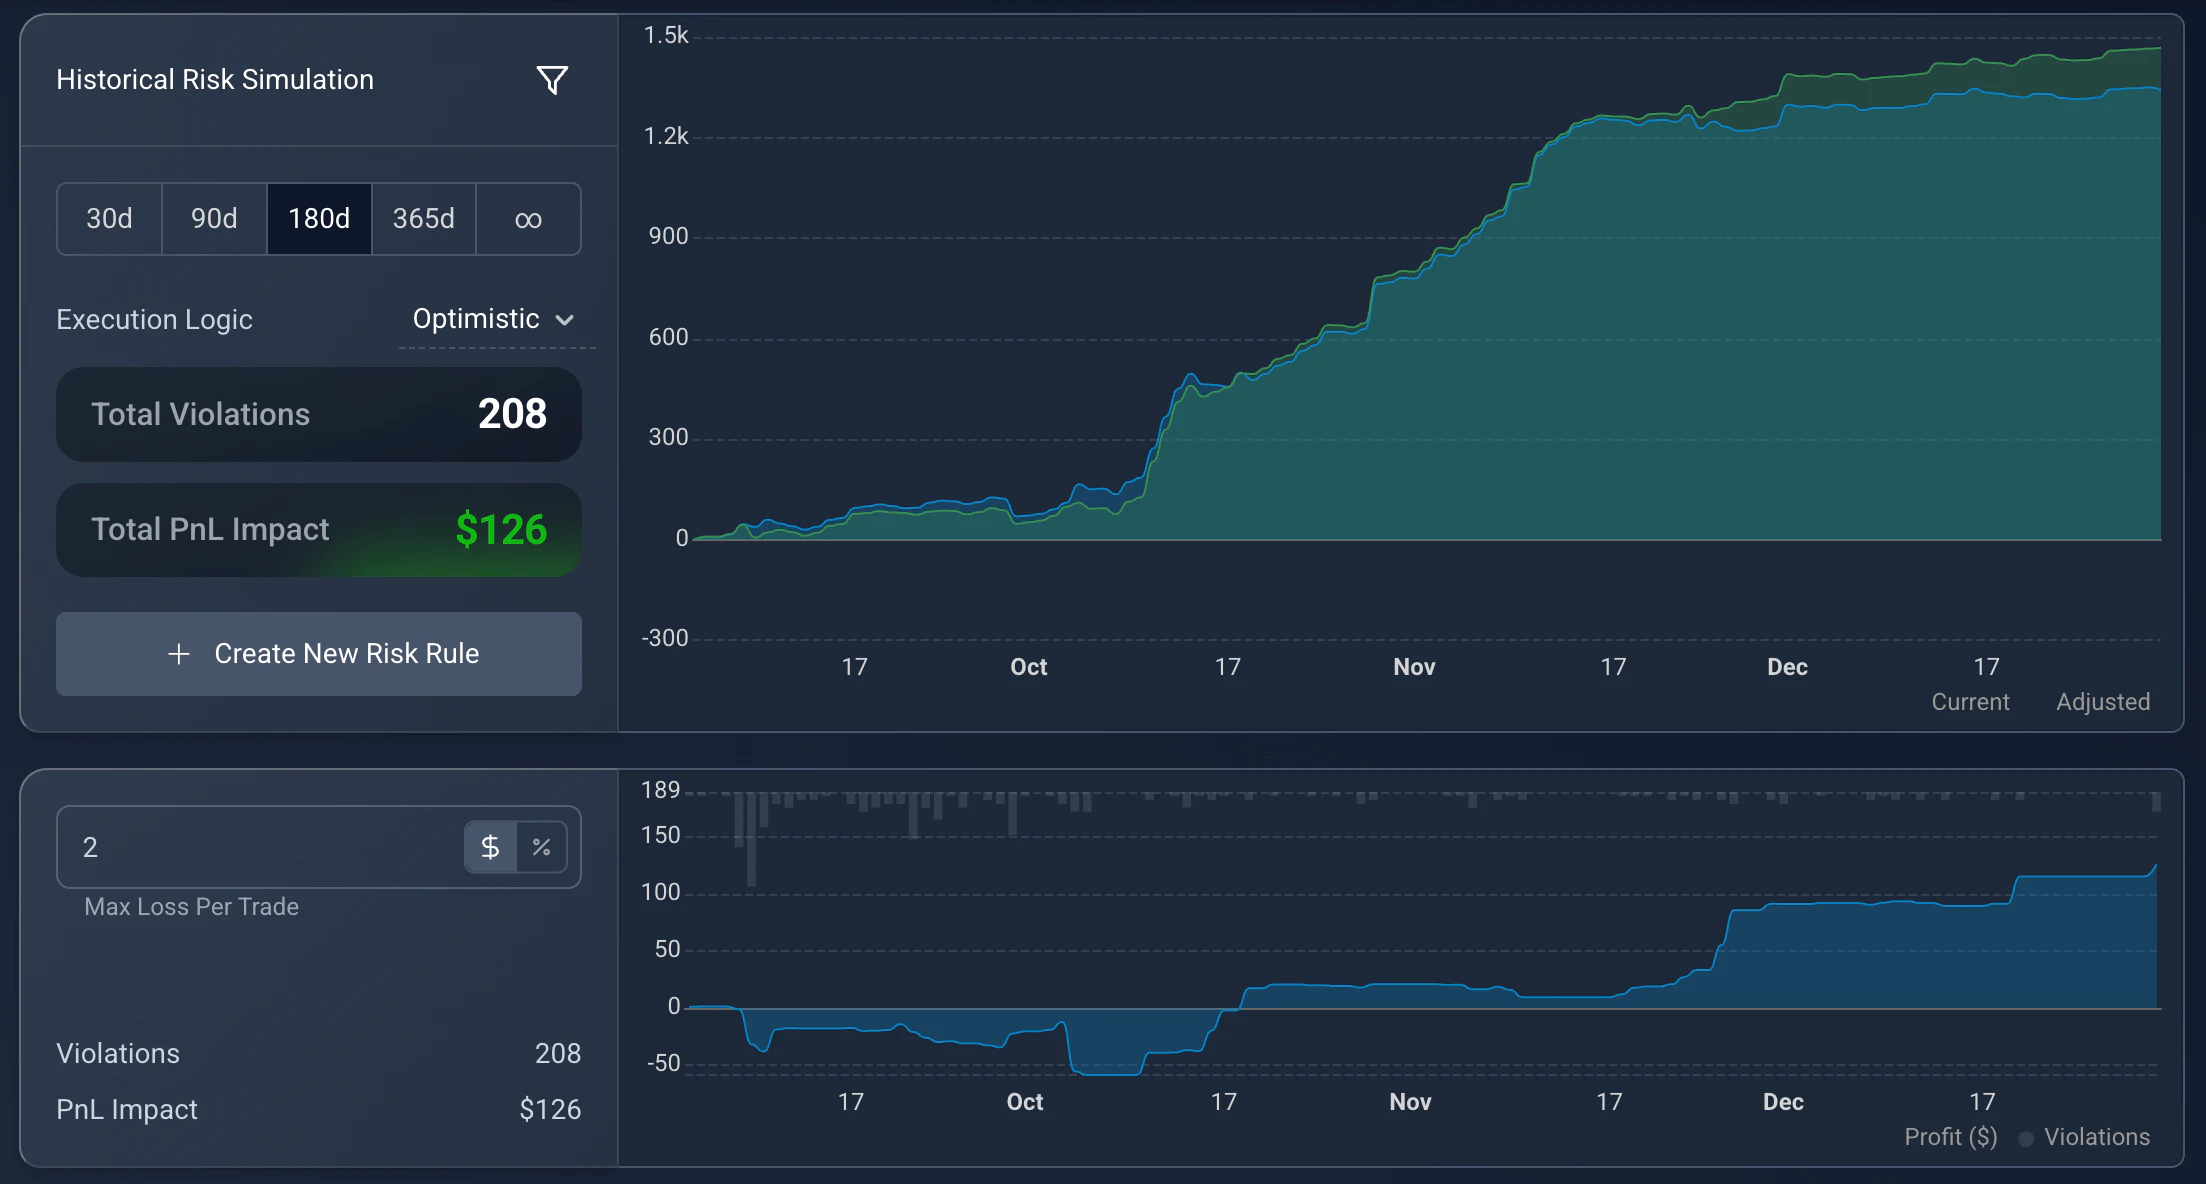
Крок 2: введіть ліміти для перевірки — макс. збиток на угоду, макс. денний збиток, макс. плече.
Backtester input parameters. Reused from _media/risk-management-v2/backtest_input (Mar 2026).
Крок 3 — прочитайте симуляцію
Натисніть Запустити бектест — і система проаналізує кожну вашу угоду. На графіку накладаються дві криві: синя область — ваш реальний PnL, а зелена лінія — крива капіталу, якби ви дотримувалися правил.
Якщо зелена лінія значно нижча за синю, ви часто «пересиджуєте» збитки — даєте угоді піти глибоко в мінус, доки вона не розвернеться в прибуток. Суворий ліміт відрізає такі відновлення, і це видно як вертикальний провал. Натисніть точку на графіку, щоб побачити, який день спричинив розбіжність.
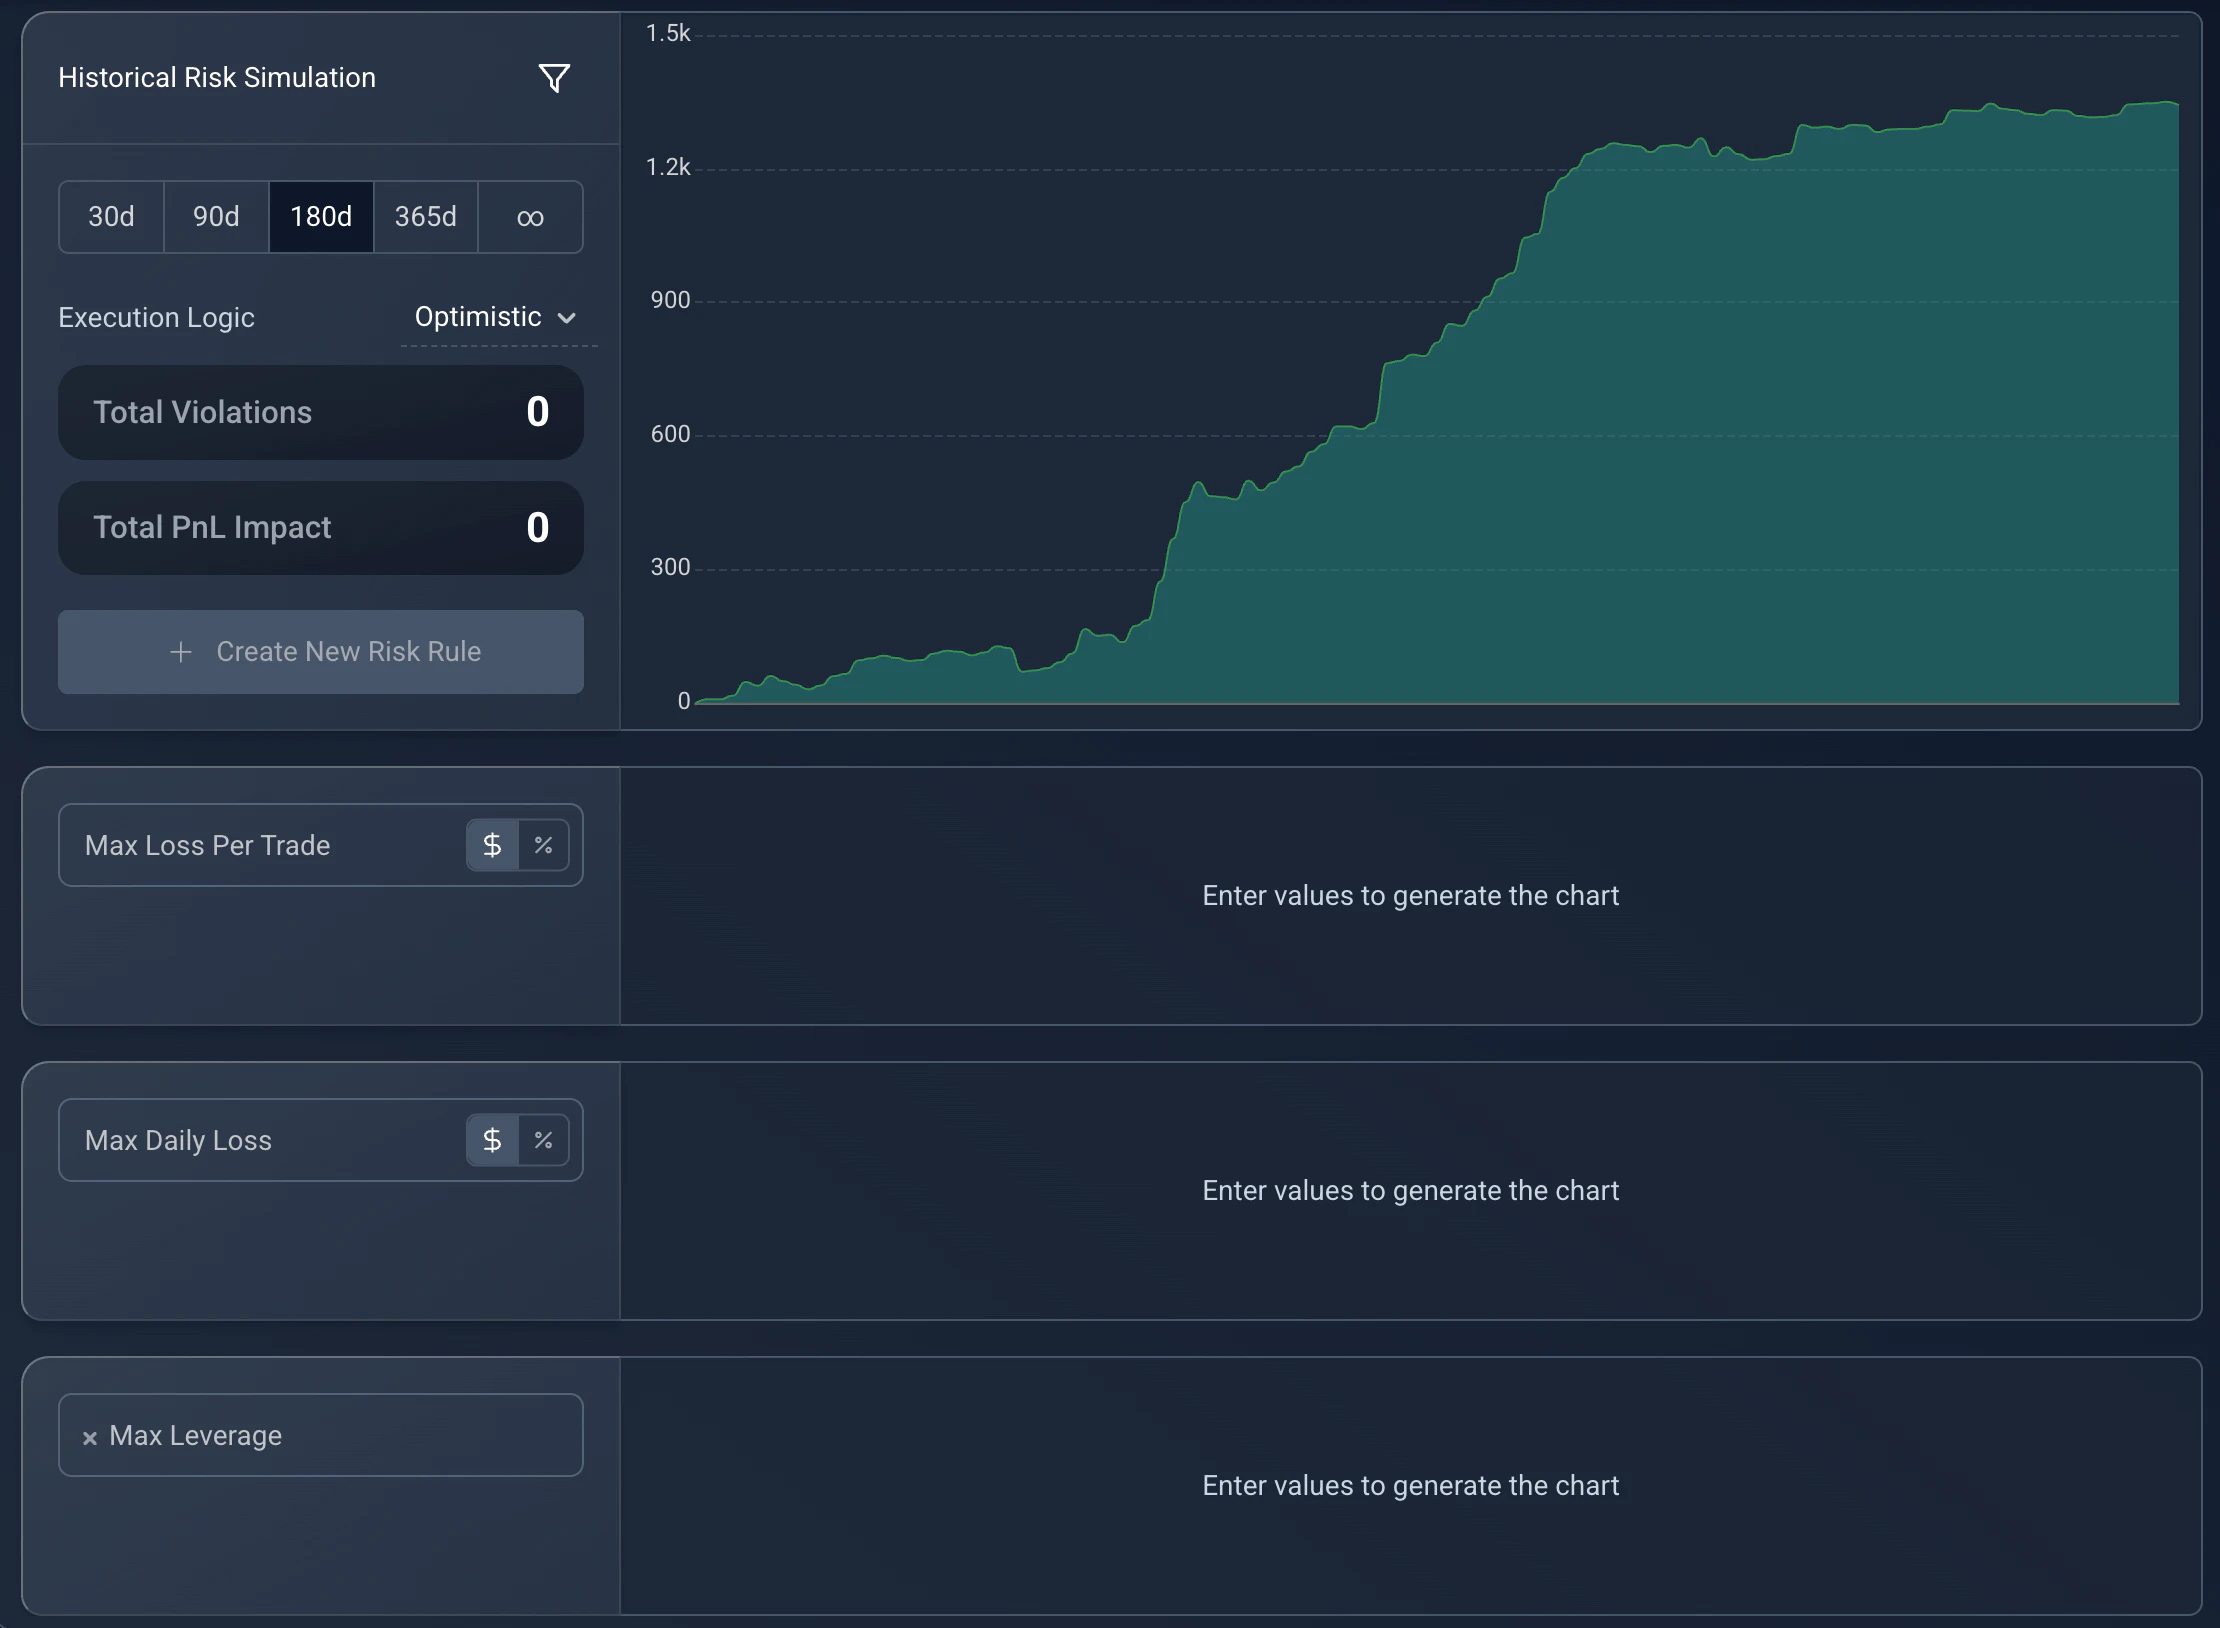
Крок 3: синя область — ваш реальний PnL; зелена лінія — крива капіталу за дотримання правил.
Backtester results graph. Reused from _media/risk-management-v2/backtest_overview (Mar 2026).
Оптимістичний проти реалістичного виконання
Це налаштування вирішує, як симулятор обробляє угоду, що пробиває ваш денний ліміт:
- •Оптимістичний — вважає, що ви зрізали збиток рівно на ліміті (денний ліміт −$500, ви виходите точно на −$500). Тобто ідеальне виконання.
- •Реалістичний — записує весь збиток угоди, яка пробила ліміт, а потім ігнорує всі наступні угоди цього дня.
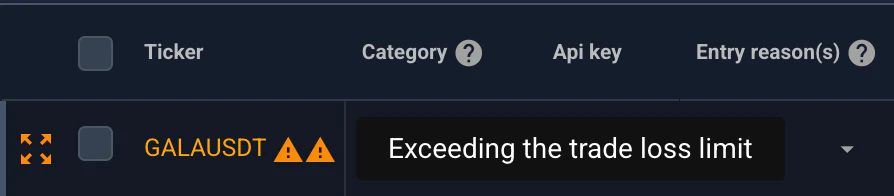
Угоди, що порушили правило, позначені жовтою іконкою попередження.
My Trades list, violation marker. Reused from _media/risk-management-v2/trades_list_example_violation (Mar 2026).
Активний моніторинг і сповіщення
Коли ви вмикаєте правило, застосунок стежить за вашими угодами в реальному часі й фіксує кожне порушення — він не блокує вас, а тримає у відповідальності. Натисніть будь-яке порушення, щоб побачити конкретну угоду, яка його спричинила.
Додайте підключення Telegram або Discord, щоб отримувати миттєві сповіщення (наприклад, «⚠️ Перевищено денний ліміт збитку: −$505, ліміт: −$500»). У застосунку угоди, що порушили правило, позначаються жовтою іконкою попередження.