Overbought and Oversold Indicators for Technical Analysis

When trying to identify the best time to buy and sell financial instruments like cryptocurrencies, it's recommended to first identify if the asset is overbought or oversold.
- The market is considered oversold if it has dropped significantly and is anticipated to rise again. When an asset is trading at a discount to its true value, the market is said to be oversold. Price increases in oversold markets are more common than in overbought ones because buyers flood into the market in response to the reduced supply.
- An overbought condition has gained rapidly and may be ready for a consolidation or correction. It is characterized by a prolonged phase of positive incline. As a result, the market exceeds its real price relative to supply and demand principle. This will lead to widespread agreement amongst investors that the asset is priced too high and signal an impending sell-off. With this, a rebound or retreat are soon to happen, and the crypto chart will fall.
Knowing how to spot overvalued and undervalued signals may help you make strategic decisions about the right time to act or hold, which crypto to purchase, and if a sentiment shift is approaching. The ability to eliminate risks and execute educated actions is made possible by having this understanding.
When doing technical analysis, there is no shortage of indications of overvalued or undervalued crypto. So, here are some of the best overbought oversold indicator:
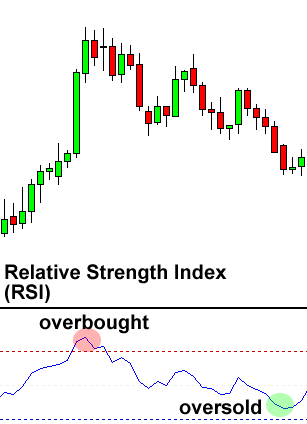
Relative Strength Index (RSI)
The purpose of RSI, an oscillating market strength measurement, is to monitor the rate and extent of movement, or price action, in the chart. The RSI value varies from 0 to 100, taking into account the average gains and losses of an investment over a given time period.
To determine if a cryptocurrency is currently overvalued or undervalued, many investors rely on this trend. A reversal in trend or a trade signal may be found using this oscillating indicator. Investors use the range from the spread of this metric to better anticipate when to take action.
If the indicator is moving upward around 100, it shows that gains have been consistently outpacing losses throughout the specified period. If the strength metric has a high value, the bullish trend is solid and lasting. In contrast, during a prolonged and severe slump, this indicator will decline near zero.
If the indicator reaches over 70, it suggests that prices have been surging for a prolonged period. Technical investors often look for an RSI reversal below 70 as a possible time to liquidate their crypto holdings.
When the indicator reaches 30, the market is said to be undervalued. Some technical investors wait for a positive entry signal if the RSI reaches above 30. Similarly, investors might use overbought levels as exit indications.
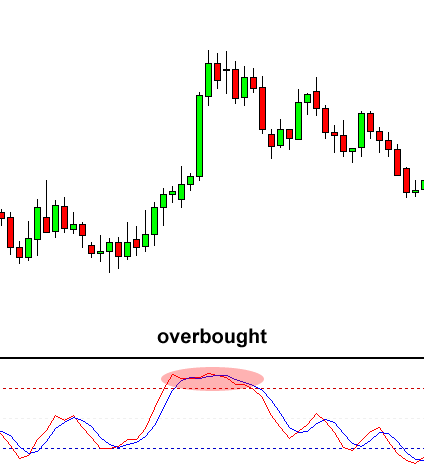
Stochastic Indicator
Stochastic is a very sensitive charting metric. It is recommended for investing methods that involve gauging price ranges and spotting a trend’s change in direction. This means that stochastics should not be utilized to verify a direction or spot a shift in market sentiment whenever there’s a strongly trending asset.
Investing with stochastics involves comparing the current value with the price range over a certain timeframe. During an uptrend, the crypto often closes around its highs, while during a downtrend, it typically closes near its lows. Therefore, when the crypto approaches closer to its average or midpoint, it shows that the movement is losing steam and a shift in direction could soon happen.
If the stochastic value is 100, it shows that the value when the session ended was at its peak inside the specified timeframe. This oscillator metric is usually plotted based on data from the prior fourteen-day period. The market is considered overvalued when the lines rise over 80 (The market may be oversold if the lines fall below 20)
In a market heading upwards, this metric typically predicts that the value of crypto will close around the high. But when prices are falling, the market is said to be in a bear market. The loss in distance between the peak and bottom at the market's final price shows weakness in the prevailing movement of price.
Moving Average Envelope
The MAE range metric is a momentum oscillator that helps determine if a market is overvalued or oversold at a certain period of time. If the crypto's value moves past the top or bottom of a certain EMA by a given percentage, the MAE metric is possible to utilize. Investors often use the Percent Price Oscillator (PPO) to figure out the percentage difference between a short and a long EMA.
When the PPO metric crosses the top or bottom of a predetermined level, it shows when the crypto is undervalued or overvalued. The same can be said for when the MAE crosses the top or bottom of a level. If the crypto passes over the top envelope line, it's an overbought signal, while a drop below the bottom envelope line shows an oversold signal.
Bullish uptrends often see prices break over the upper envelope and stay there. In reality, while pricing remains over the top envelope, the top envelope line will widen. An overbought MAE reading may be a bullish indicator during a sustained upswing. Because of this, overbought and oversold levels are most useful when the trend is somewhat flat.
Both overbought and oversold levels should act as red flags, prompting more research. The presence of resistance on the chart is a reliable indicator of an overvalued market. Swing traders may also use bearish patterns to strengthen the case for a reversal when prices are too high. The same holds true for confirming oversold levels. In addition, investors may use the presence of bullish patterns to strengthen the case for a reversal at oversold levels.
After a period of recovery, a clear envelope breach might signify the beginning of a prolonged trend. After seeing an upward trend, technical analysts may use swing trading indicators and other methods to spot undervalued areas and corrections within the trend. When trading inside a larger downturn, overvalued levels and rebounds may be leveraged as liquidation points.
Parabolic Stop and Reverse (SAR)
To help traders capitalize on price fluctuations, this particular oscillating metric takes into account the direction and velocity of price changes to understand overvalued or undervalued crypto assets.
This overlay metric plots a dotted line at the top and lower parts of the chart, which shows the direction of the movement. If there is a dot below the price, it means that the bulls are in charge, triggering an upward momentum. As long as the dot is located at the top of the price, selling pressure and negative sentiment are present. If the dots begin to shift, it may signal an impending reversal.
Increasing the distance between the dots on this metric indicates more abrupt price shifts. As the dots get closer together, it means the prevailing movement is losing steam; the crypto is approaching its peak or trough of a curve, which means that it is likely to reverse.
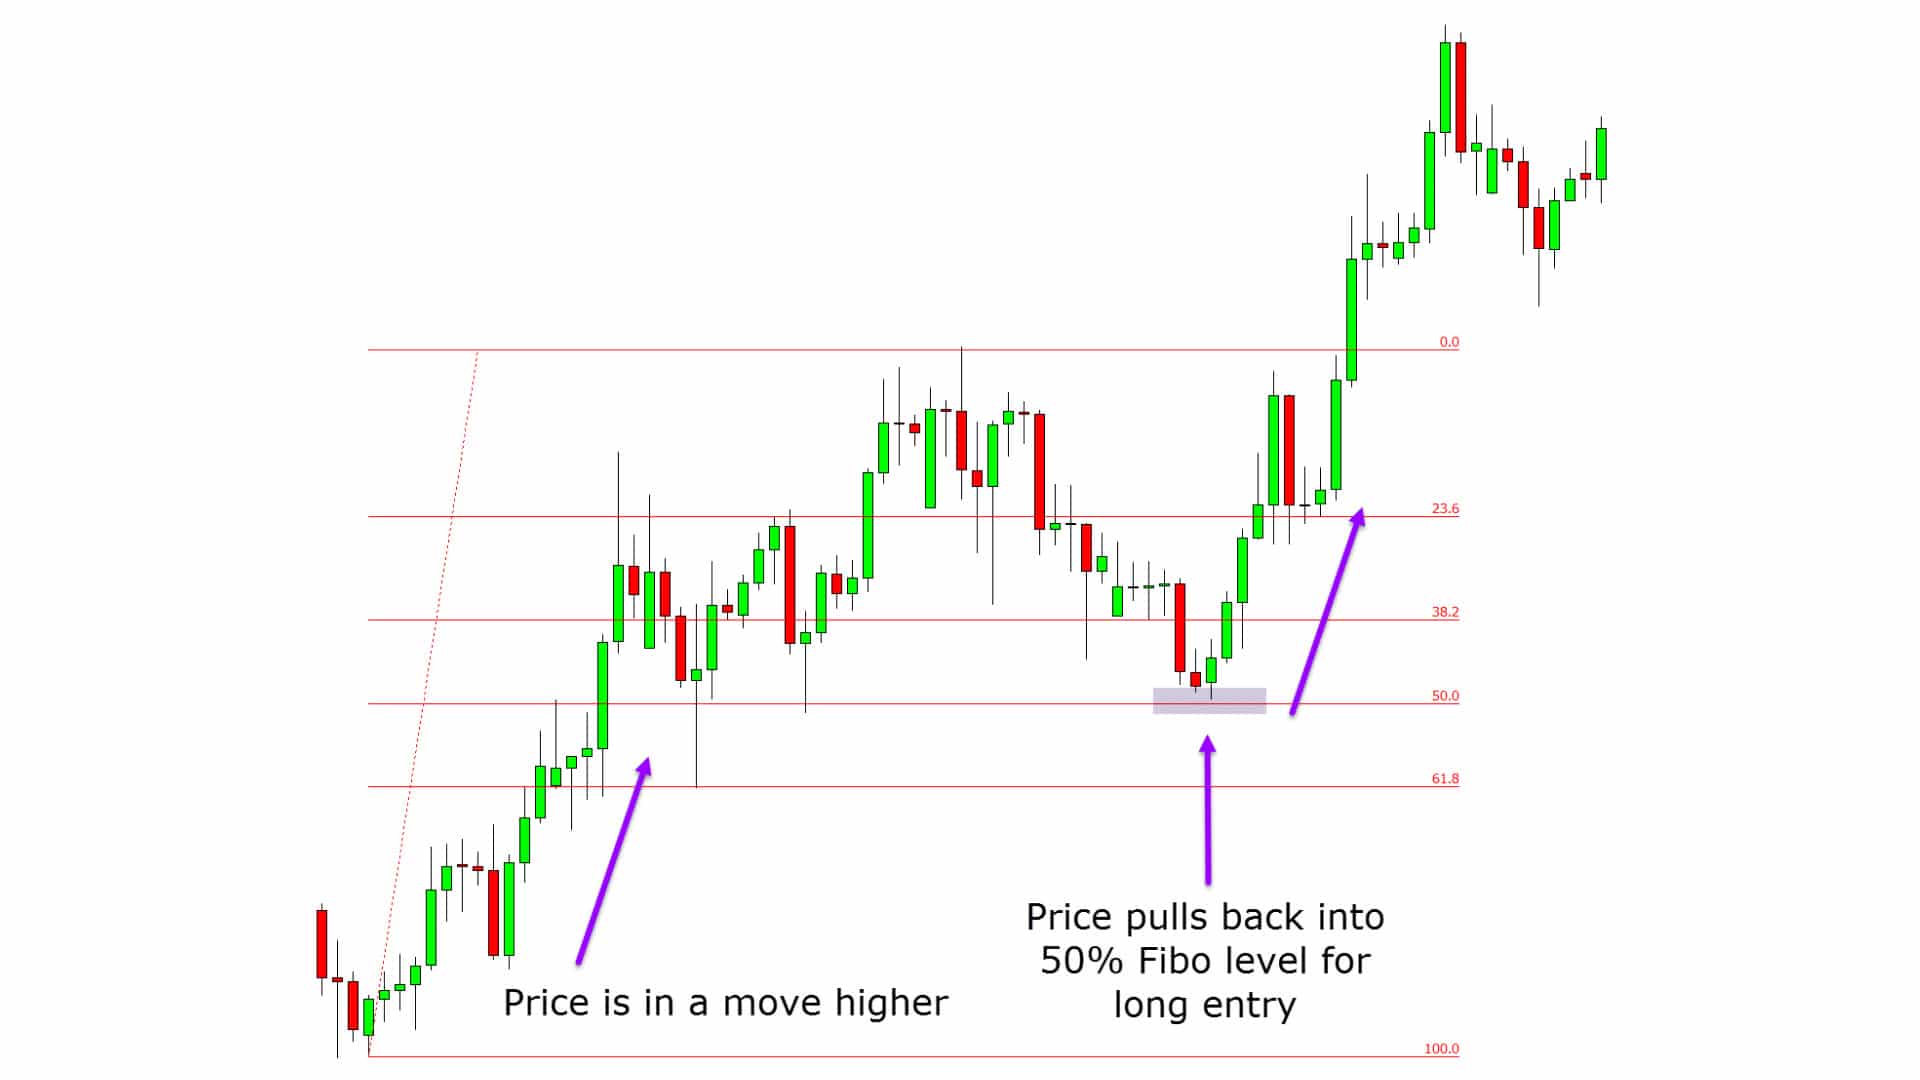
Fibonacci Retracement
Fibonacci Retracement can determine if a market is overvalued or undervalued based on current chart activity. According to the idea behind this metric, the market will almost always retrace anywhere between 50 and 100 percent of the original price after a significant price shift. This fifty percentile level is between the percentiles of 38 and 61, which is referred to as the bookends for a bigger "zone" of expected decline.
Investors might put themselves in a precarious situation when they commit to achieving certain price points instead of closing their position and taking a profit. The optimal way to employ this charting metric is to act only when overbought or oversold circumstances have formed. Stop-loss orders may be used to protect your funds after you reach this level, allowing you to pursue more gains despite the market's regression.
Overvalued crypto may be reflected in a price decline when assets consistently fail to overcome a specific line of resistance. Similar to other oscillating metrics, the association between the projected price points and overvalued or undervalued markets may be confirmed by using other oscillating metrics or additional indicators.
Emotional Indicator in Crypto Trading
There will always be holes in your strategies, no matter how well you understand and can interpret overbought and oversold indicators. Only by keeping careful records and keeping a constant watch on your trades will you be able to alleviate these concerns.
However, it's quite difficult to keep track of all your trades, especially if you're using different exchanges. Furthermore, keeping track of other important information, such as your trading idea or reasons for entering a trade, is often overlooked. Emotional control in trading should also be considered because it’s one of the core foundations of being a successful trader.
Fortunately, an automated trading journal can help you quickly identify any weak points in your strategy and improve your current style. With this, you can minimize your losses and start earning more profit. By collecting and monitoring the necessary data points, you are also able to recreate the factors that generate wins.
By keeping track of all of your trades, you'll have an opportunity to examine them in totality. When it comes to automated trading journals, Trader Make Money is your best option. The comprehensive dashboard is where you can personalize anything from the widgets to the analytics tools. This will make it much simpler to isolate the factors that contributed to your failure and steadily enhance your efficiency.