Digest: Top Useful Widgets in TMM Trading Journal


An automated trading journal is essential to an effective trading strategy. It allows trader to analyze their results and make informed decisions. For a more effective analysis, start using widgets! They will help you quickly and easily evaluate the effectiveness of your strategy.
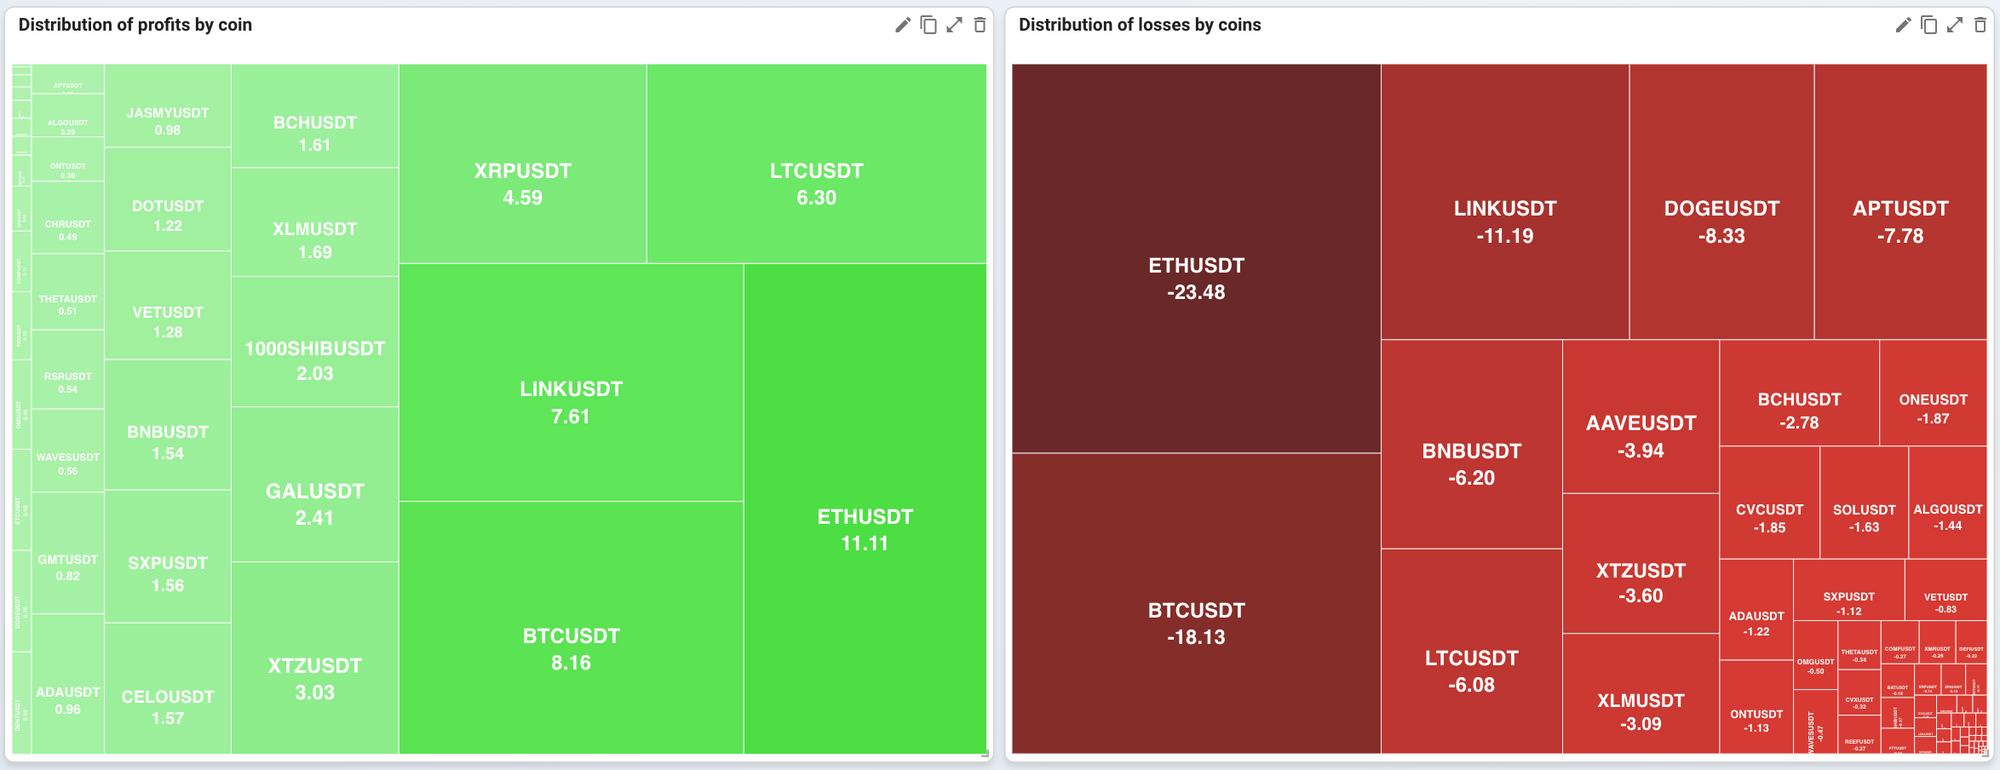
Widget "Distribution of profits/losses by coins"
Working with these widgets is straightforward yet powerful:
- The "Distribution of profits by coin" widget will help you determine which coins bring you the most profit and focus on them.
- The widget "Distribution of losses by coins" will help you determine and exclude which coins bring you the most losses.
In addition, pay attention to coins that do not bring significant benefits. Yes, when trading them, you do not lose or earn anything. Pay attention that you spend a lot of time and resources on such trades.
But the widget is just a tool. Remember to analyze deeper! Let's assume you have the most unprofitable coin X. Review your trades with this coin. What were your entering reasons? In what state did you make the trade? What was the overall market like? Did you conclude the trade to find out the reason for the failure? With just a few clicks, you can add all this data to your journal for each trade and then analyze it, which will help you increase your trading tenfold.
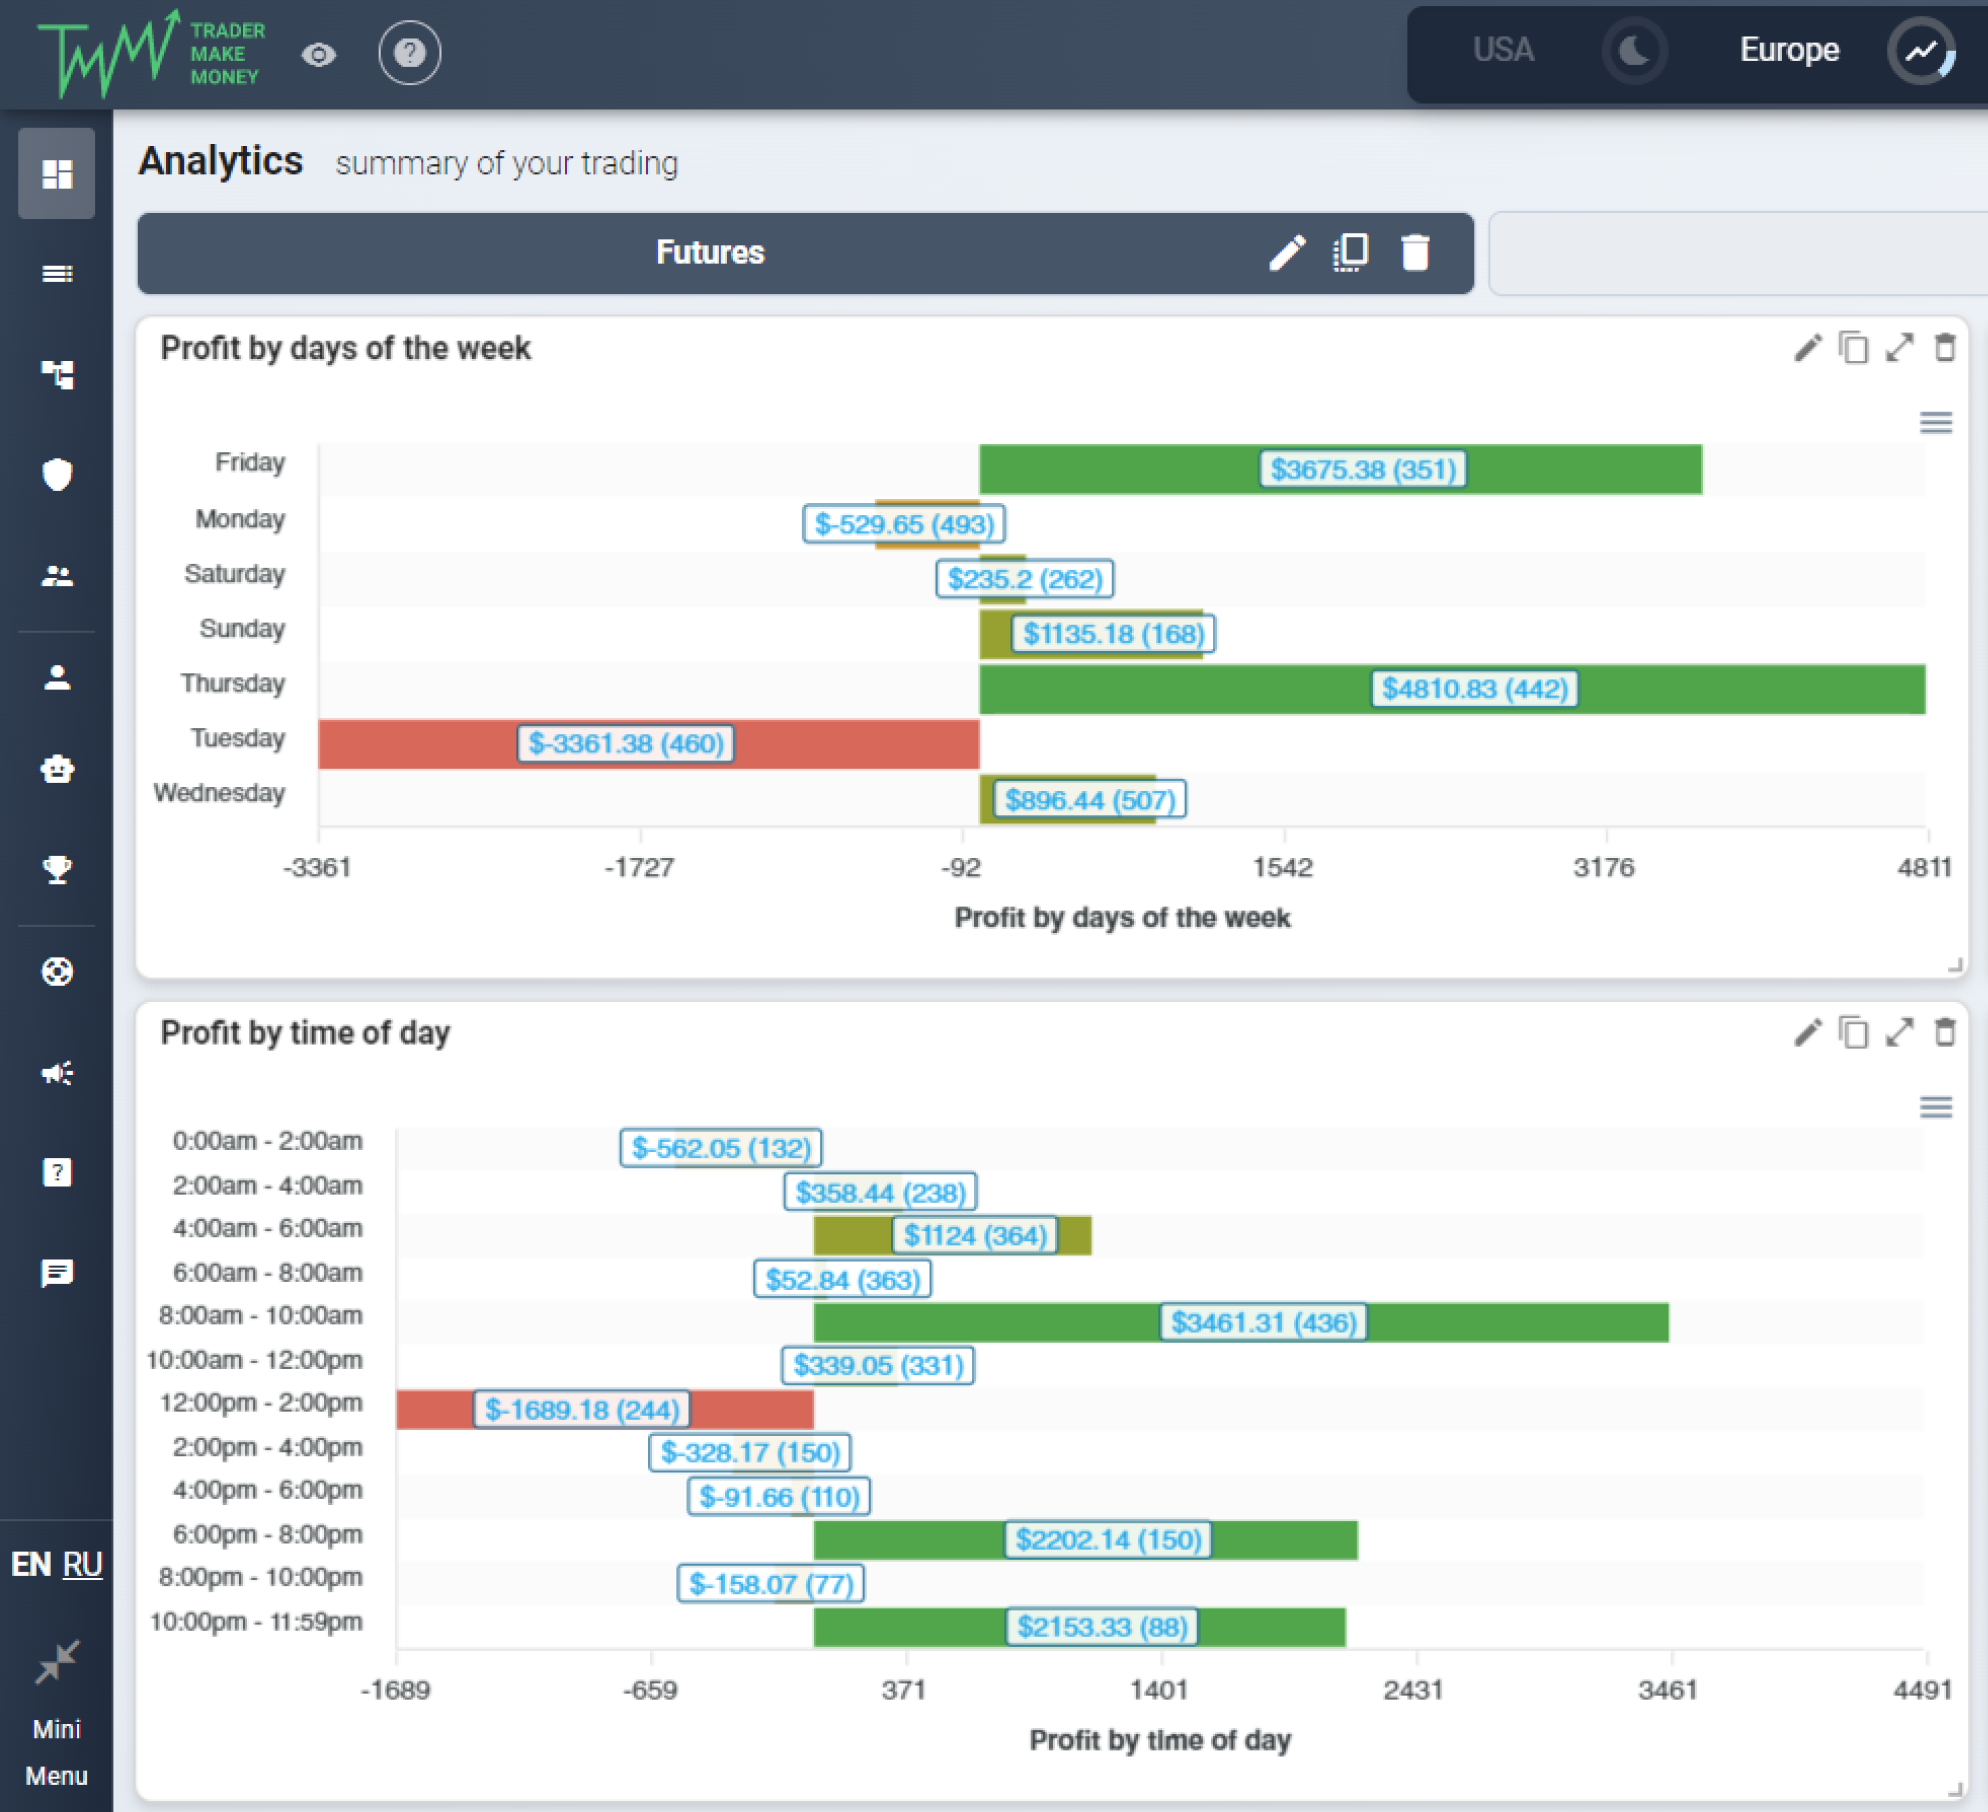
Widgets "Profit by days of the week" and "Profit by time of day"
They will show you when you are making more profitable or losing trades and help you:
a) find your "effective time" ⇒ save time for rest ⇒ a happy trader = a successful trader;
b) increase your trading performance.
Using the widgets, you will see on what day and time you can afford to break away from the charts without losing efficiency (and even to improve trading results!) and have coffee, meet friends, or watch an excellent movie. You can even talk about trading to get motivated for a new trading day.
Focus on those days/times when you have the maximum profit. But remember to analyze what kind of trades you made, what the market was like, and why you entered the trade, and amplify it!
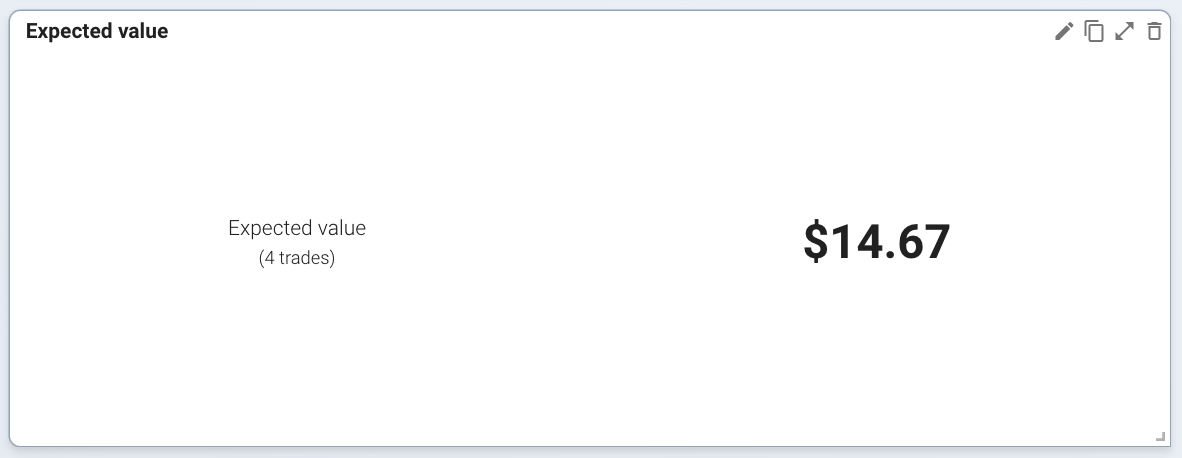
Widget "Expected value"
Calculates the average win or loss for each trade and displays the total mathematical expectation for all trades. This allows the trader to assess how profitable his trading strategy is quick.
For example, a trader has a trading system that allows him to make $1,000 in 60% of cases and lose $500 in the remaining 40%. Then the Expected value of his winnings is:
(0.6 * $1000) + (0.4 * -$500) = $400
This means that, on average, each trade will bring the trader a profit of $400. Of course, in practice, the results may differ, but in the long run, it can be used to evaluate the trading system and make decisions about its further use. It is also worth considering that the Expected value can change depending on the size of the trade and the level of risk, so you should consider all these factors when analyzing your trades.
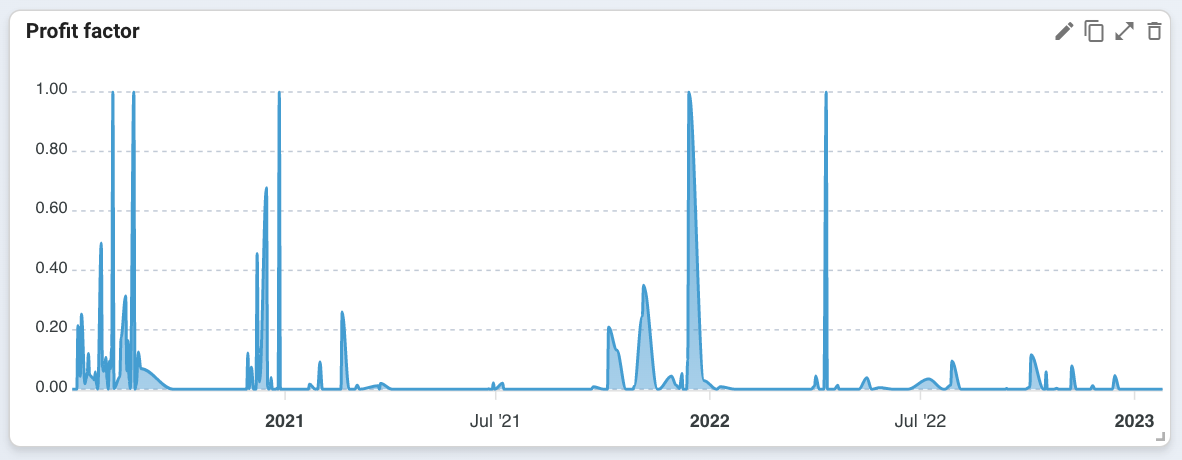
Widget "Profit Factor"
It calculates the total win-to-total loss ratio and displays it on a chart. This allows you to quickly determine how profitable a trader's strategy is in the long run.
The Profit Factor can be calculated using the following formula:
Profit Factor = Wins / Losses
For example, if a trader earned $10,000 in the last month and lost $5,000, then the profit factor would be:
Profit Factor = $10,000 / $5,000 = 2
This means that each win is twice the loss. The higher the profit factor, the more profitable the trading system is considered.
Widgets “Average profit per trade” and “Average profit per day”
help you to find out the profitability of your trade to the cent in just a few clicks
- “Average profit per trade” (chart) clearly on the chart by day, it will show your biggest profit or loss. With this data, you can analyze each trading day point by point and understand why the trade worked in plus or minus.
And if you look at trades over a long distance, you have the opportunity to find repeating patterns, for example, entry reasons that worked worse or better.
- “ Average profit per day” show your average profit for the period of time. You can make successful trades at the moment, but in the long run it may turn out that you regularly go into the red.
All of these widgets are available in our journal and automatically calculate the performance of your past trades.
✏️ With the help of Pencil, you can customize any widget by filtering it by the desired indicators, for example, date, API key, day of the week, and entry reasons - the possibilities for your analysis and strategizing are endless!
On the "Novice" tariff, you can add no more than three widgets. If this number is not enough for you, you can upgrade to the "Trader PRO", and add infinite widgets to your trading journal.
These widgets will allow you to quickly evaluate your results and make informed decisions about further trading. However, it is worth remembering that these widgets are not the only tool for analyzing trading results. It is essential to take into account other indicators as well, such as the percentage of winning trades, the average win and loss, and others. You can also easily track these indicators in our trading journal TraderMake.Money 💸