Charting 101: 5 Day Trading Patterns You Should Track


What does pattern day trading mean?
Cryptocurrency traders use technical analysis to identify profitable trades, which usually involve day trading patterns, or the trends and price movements in a market chart. Such chart formations help traders generate strategies they can rely on. So, if you want to become a pro, we recommend studying these charting formations so that you can include them in your arsenal.
TOP 5 Trading Patterns
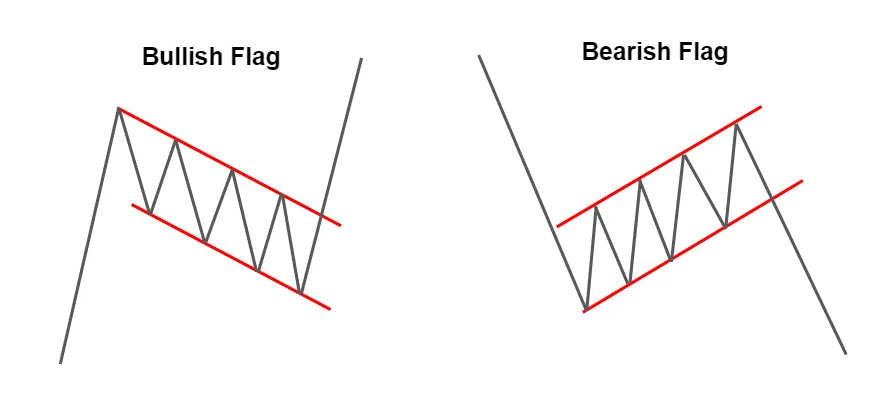
Bullish and Bearish Flags
So, what’s pattern day trading mean using Bullish flags? It’s when a crypto undergoes an initial surge (flagpole), then a brief period of stability (flag), and finally a renewed ascent. The bearish formation happens when the crypto first drops precipitously (flagpole), then levels off (flag), and then drops again.
- How to use: First, you must find the flagpole, or the first significant market action. After this, link the consolidation phase's highs and lows with two parallel lines. The continuance of momentum is indicated by the breakout from the consolidation phase. The length of the upswing might serve as the target value.
- Tip: Look for a strong flagpole that experiences high volume and extends at least 2-3 times the size of the flag.
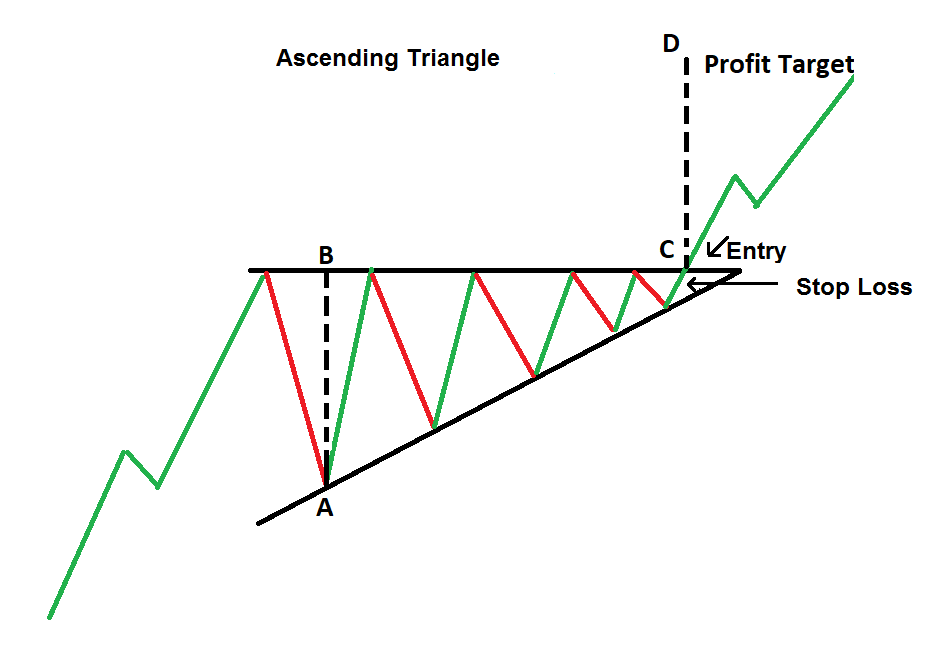
Ascending and Descending Triangles
This formation occurs when a crypto price experiences a series of higher lows, forming a trend line, while encountering a flat resistance level that forms the other side of the formation. Descending triangles occur when a crypto price experiences a series of lower highs, creating a trend line, while encountering a flat support level that creates the other side of the shape.
- How to use: In order to profit from this chart pattern trading, you must first locate the historical trends and the horizontal line that together create the triangle. After that, you should watch for a triangular breakout in the direction of the trend. A good trading objective is the elevation of the triangle at its base. The horizontal line might act as a stop-loss level for your transaction.
- Tip: If you see the formation during surge, you can look for a break above the horizontal resistance line. Go long at this point and set your stop loss below the lower trend line. You can then measure its height relative to the breakout point to get your target.
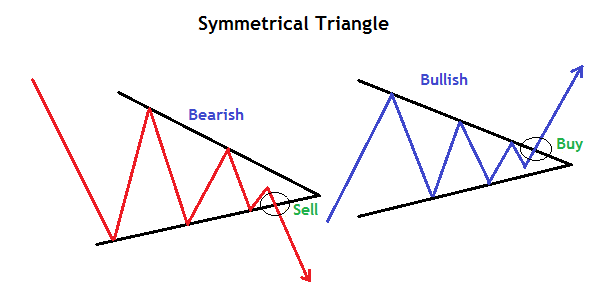
Bullish and Bearish Symmetrical Triangles
The bullish type occurs when the market experiences a series of lower highs and higher lows, forming two converging lines that meet at a roughly equal point, creating the exact shape. The bearish formation occurs when the market suffers from a series of higher highs and lower lows, creating two converging trend lines that meet at a roughly equal point.
- How to use: To utilize, you must first identify the line of the triangle. Do nothing until the formation breaks out in the direction of the movement. The apex of the triangle should be raised as a trading target. You may also use the stop-loss level represented by the opposite trend line.
- Tip: Watch for the price to rise above the trend line if the market is in a surge. Long orders can be placed now, with stops placed below the descending trend line. After determining the breakout point, the target may then be calculated by projecting the height of the formation.
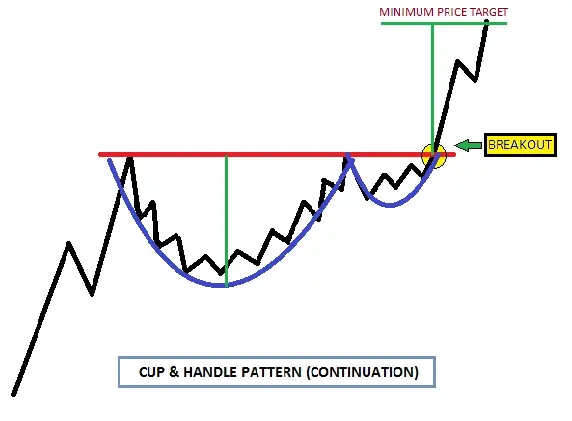
Cup and Handle
Bullish flags occur when a crypto price experiences a sharp increase (flagpole) followed by a period of consolidation (flag) before continuing the upward trend. Bearish flags occur when a crypto price experiences a sharp decrease (flagpole) followed by a period of consolidation (flag) before continuing the downward trend.
- How to use: The price has to break over the resistance level, which is the rim of the cup. When it breaches this level on big volume, it means buyers are exerting a lot of pressure and it's a good time to go into a long position. Your stop loss level can be somewhere below the low of the handle, or if you need more leeway, the lower part of the cup. If you know the depth of the cup, you can calculate your aim from there.
- Tip: The handle should form in the upper half of the cup and should not retrace more than 50% of the depth of the cup.
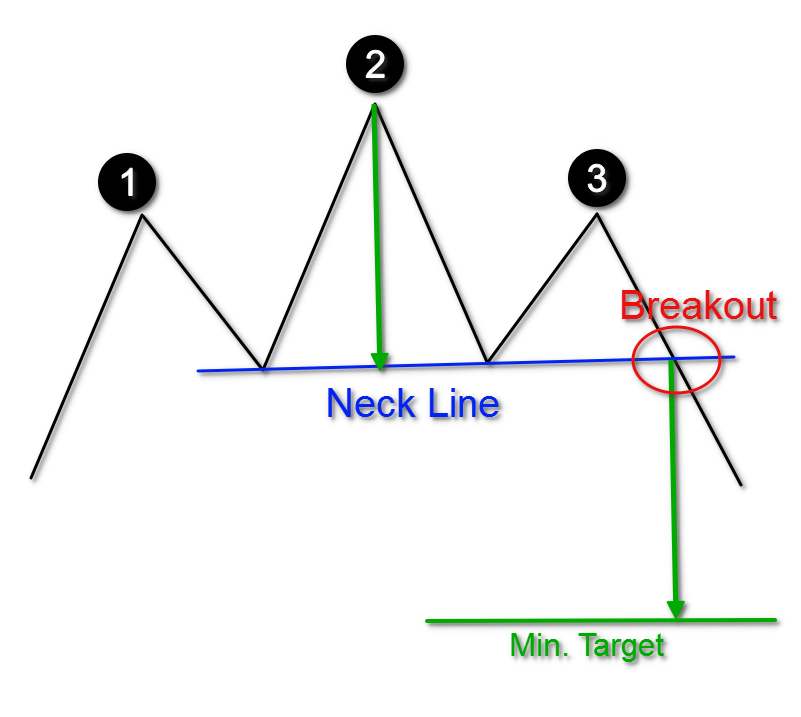
Head and Shoulders
Bullish flags occur when a crypto price experiences a sharp increase (flagpole) followed by a period of consolidation (flag) before continuing the upward trend. Bearish flags occur when a crypto price experiences a sharp decrease (flagpole) followed by a period of consolidation (flag) before continuing the downward trend.
- How to use: Identify the three peaks and the neckline. Wait for a break below the neckline with high volume, indicating strong selling pressure. You can enter a short position when the price breaks below the neckline and set your stop loss above the right peak, or above the middle peak for more room. You can set your target by subtracting the length of the formation from the breakout point.
- Tip: A bearish engulfing candle, shooting star, moving average crossing, or MACD divergence are all signals to confirm a breakthrough below the neckline.
Identifying day trading formations on the chart is the next big step in becoming a pro trader. But the use of technical analysis to identify trends should always be matched with fundamental analysis to analyze economics and determine the underlying value of a cryptocurrency. To make informed trading decisions, traders should use a combination of both approaches, as no single approach is foolproof.
In conjunction with identifying trading patterns, an automated trading journal like TraderMake.Money can also be used to evaluate the performance of trading strategies, gain valuable insights, and identify areas for improvement.